Lowe's 2013 Annual Report Download - page 41
Download and view the complete annual report
Please find page 41 of the 2013 Lowe's annual report below. You can navigate through the pages in the report by either clicking on the pages listed below, or by using the keyword search tool below to find specific information within the annual report.-
 1
1 -
2
-
3
-
4
-
5
-
6
-
7
-
8
-
9
-
10
-
11
-
12
-
13
-
14
-
15
-
16
-
17
-
18
-
19
-
20
-
21
-
22
-
23
-
24
-
25
-
26
-
27
-
28
-
29
-
30
-
 31
31 -
 32
32 -
 33
33 -
 34
34 -
 35
35 -
 36
36 -
 37
37 -
 38
38 -
 39
39 -
 40
40 -
 41
41 -
 42
42 -
 43
43 -
 44
44 -
 45
45 -
 46
46 -
 47
47 -
 48
48 -
 49
49 -
 50
50 -
 51
51 -
52
-
53
-
54
-
55
-
56
-
57
-
58
-
59
-
60
-
61
-
62
-
63
-
64
-
65
-
66
-
67
-
68
-
69
-
70
-
71
-
72
-
73
-
74
-
75
-
76
-
77
-
78
-
79
-
80
-
81
-
82
-
83
-
84
-
85
 |
 |
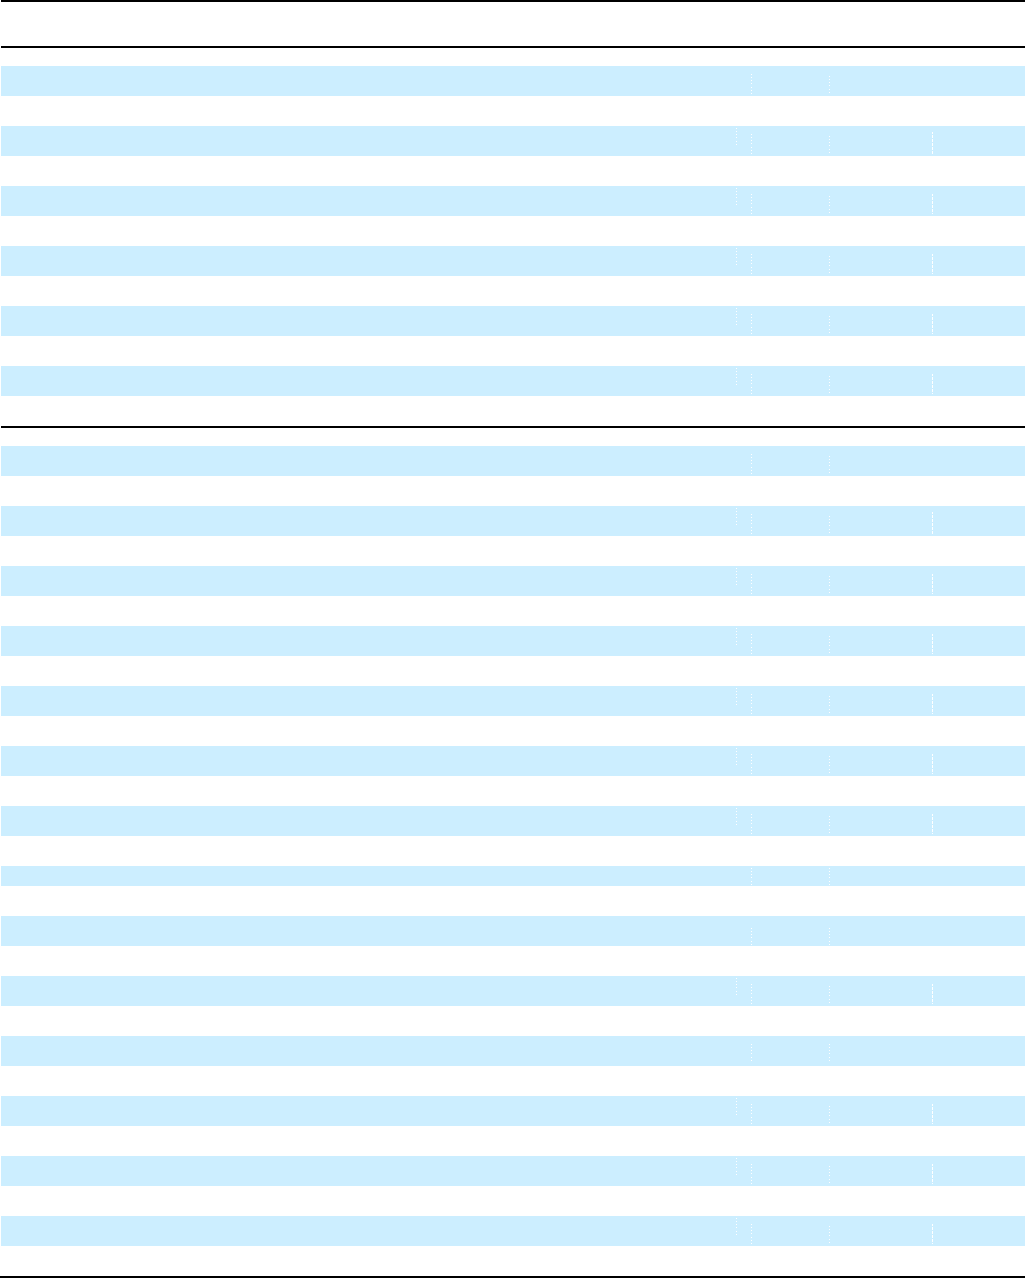
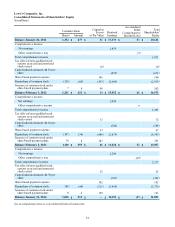
33
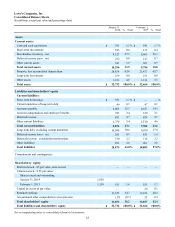
Lowe's Companies, Inc.
Consolidated Balance Sheets
(In millions, except par value and percentage data)
January 31,
2014
% Total
February 1,
2013
% Total
Assets
Current assets:
Cash and cash equivalents
$
391
1.2
%
$
541
1.7
%
Short-term investments
185
0.6
125
0.4
Merchandise inventory - net
9,127
27.9
8,600
26.3
Deferred income taxes - net
252
0.8
217
0.7
Other current assets
341
1.0
301
0.9
Total current assets
10,296
31.5
9,784
30.0
Property, less accumulated depreciation
20,834
63.6
21,477
65.7
Long-term investments
279
0.9
271
0.8
Other assets
1,323
4.0
1,134
3.5
Total assets
$
32,732
100.0
%
$
32,666
100.0
%
Liabilities and shareholders' equity
Current liabilities:
Short-term borrowings
$
386
1.2
%
$
—
—
%
Current maturities of long-term debt
49
0.1
47
0.1
Accounts payable
5,008
15.3
4,657
14.3
Accrued compensation and employee benefits
785
2.4
670
2.1
Deferred revenue
892
2.7
824
2.5
Other current liabilities
1,756
5.4
1,510
4.6
Total current liabilities
8,876
27.1
7,708
23.6
Long-term debt, excluding current maturities
10,086
30.8
9,030
27.6
Deferred income taxes - net
291
0.9
455
1.4
Deferred revenue - extended protection plans
730
2.2
715
2.2
Other liabilities
896
2.8
901
2.8
Total liabilities
20,879
63.8
%
18,809
57.6
%
Commitments and contingencies
Shareholders' equity:
Preferred stock - $5 par value, none issued
—
—
—
—
Common stock - $.50 par value;
Shares issued and outstanding
January 31, 2014
1,030
February 1, 2013
1,110
515
1.6
555
1.7
Capital in excess of par value
—
—
26
0.1
Retained earnings
11,355
34.7
13,224
40.4
Accumulated other comprehensive (loss)/income
(17
)
(0.1
)
52
0.2
Total shareholders' equity
11,853
36.2
13,857
42.4
Total liabilities and shareholders' equity
$
32,732
100.0
%
$
32,666
100.0
%
See accompanying notes to consolidated financial statements.