Lowe's 2013 Annual Report Download - page 28
Download and view the complete annual report
Please find page 28 of the 2013 Lowe's annual report below. You can navigate through the pages in the report by either clicking on the pages listed below, or by using the keyword search tool below to find specific information within the annual report.-
 1
1 -
2
-
3
-
4
-
5
-
6
-
7
-
8
-
9
-
10
-
11
-
12
-
13
-
14
-
15
-
16
-
17
-
 18
18 -
 19
19 -
 20
20 -
 21
21 -
 22
22 -
 23
23 -
 24
24 -
 25
25 -
 26
26 -
 27
27 -
 28
28 -
 29
29 -
 30
30 -
 31
31 -
 32
32 -
 33
33 -
 34
34 -
 35
35 -
 36
36 -
 37
37 -
 38
38 -
39
-
40
-
41
-
42
-
43
-
44
-
45
-
46
-
47
-
48
-
49
-
50
-
51
-
52
-
53
-
54
-
55
-
56
-
57
-
58
-
59
-
60
-
61
-
62
-
63
-
64
-
65
-
66
-
67
-
68
-
69
-
70
-
71
-
72
-
73
-
74
-
75
-
76
-
77
-
78
-
79
-
80
-
81
-
82
-
83
-
84
-
85
 |
 |

20
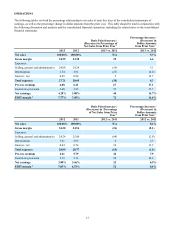
SG&A – SG&A expense for 2013 leveraged 16 basis points as a percentage of sales compared to 2012. This was driven by 17
basis points of leverage associated with casualty insurance as we cycled a reduction in the discount rate applied in the prior
year. We also experienced nine basis points of leverage due to greater long-lived asset impairments and discontinued project
expenses in the prior year and eight basis points of leverage in advertising expense due to higher sales. In addition, we
experienced eight basis points of leverage in contract labor expense as a result of lower spending on information technology
projects in the current year. These were partially offset by 14 basis points of deleverage associated with incentive
compensation due to higher attainment levels and eight basis points of deleverage as a result of reset and remerchandising
activity associated with efforts to improve customer experiences. We also experienced eight basis points of deleverage due to
higher store repair and maintenance expense.
Depreciation – Depreciation expense leveraged 27 basis points for 2013 compared to 2012 primarily due to the increase in
sales as well as assets becoming fully depreciated. Property, less accumulated depreciation, decreased to $20.8 billion at
January 31, 2014 compared to $21.5 billion at February 1, 2013. At January 31, 2014 and February 1, 2013, we owned 86%
and 89% of our stores, respectively, which included stores on leased land.
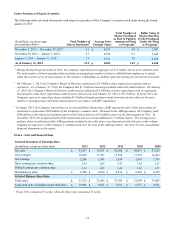
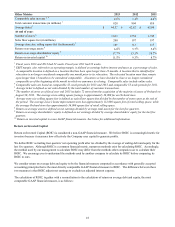
Interest – Net – Net interest expense is comprised of the following:
(In millions)
2013
2012
Interest expense, net of amount capitalized
$
474
$
427
Amortization of original issue discount and loan costs
6
5
Interest income
(4
)
(9
)
Interest - net
$
476
$
423
Net interest expense increased primarily as a result of a favorable tax settlement that resulted in a reduced interest accrual in
2012, in addition to increased expense as a result of the net increase in long-term debt.
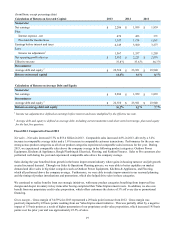
Fiscal 2012 Compared to Fiscal 2011
For the purpose of the following discussion, comparable sales, comparable average ticket and comparable customer
transactions are based on comparable 52-week periods.
Net sales – Net sales increased 0.6% to $50.5 billion in 2012. The additional week in 2011 and resulting week shift in 2012
negatively impacted sales comparisons by $692 million, or 1.4%. Comparable sales increased 1.4% in 2012, driven by a 0.9%
increase in comparable average ticket and a 0.5% increase in comparable customer transactions. Our key initiatives, Value
Improvement and Product Differentiation, drove 40 basis points of the increase in sales. In addition, our proprietary credit
value proposition contributed 65 basis points to the increase in sales. Geographically, all operating divisions in the U.S.
delivered positive comparable sales for the year as sales performance was well balanced in 2012. Furthermore, we continued to
see strength in our Pro Services business, which outperformed the company average.
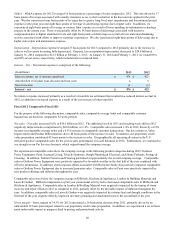
We experienced comparable sales above the company average in the following product categories during 2012: Outdoor
Power Equipment, Paint, Seasonal Living, Tools & Hardware, Rough Plumbing & Electrical, and Home Fashions, Storage &
Cleaning. In addition, Fashion Fixtures and Flooring performed at approximately the overall company average. Comparable
sales in Outdoor Power Equipment were positively impacted by favorable weather in the first half of the year combined with
effective promotions. In addition, storm response efforts associated with Hurricane Sandy also positively impacted comparable
sales in Outdoor Power Equipment due to increased generator sales. Comparable sales in Paint were positively impacted by
new product offerings and inflation throughout the year.
Comparable sales were below the company average in Millwork, Kitchens & Appliances, Lumber & Building Materials and
Lawn & Garden. Difficult comparisons to prior year promotional activity led to decreased comparable sales in Millwork and
Kitchens & Appliances. Comparable sales in Lumber & Building Material were negatively impacted by the timing of storm
recovery and repair efforts in 2012 as compared to 2011, partially offset by the favorable impact of inflation throughout the
year. In addition, comparable sales in Lawn & Garden were negatively impacted by extreme heat and drought conditions in the
first half of the year, slightly offset by improved inventory planning and attachment rates in the second half of the year.
Gross margin – Gross margin of 34.3% for 2012 represented a 26 basis point decrease from 2011, primarily driven by an
unfavorable 19 basis point impact related to our proprietary credit value proposition. In addition, we experienced a seven basis
point unfavorable impact to margin related to pricing and promotional activity.