Lowe's 2013 Annual Report Download - page 27
Download and view the complete annual report
Please find page 27 of the 2013 Lowe's annual report below. You can navigate through the pages in the report by either clicking on the pages listed below, or by using the keyword search tool below to find specific information within the annual report.-
 1
1 -
2
-
3
-
4
-
5
-
6
-
7
-
8
-
9
-
10
-
11
-
12
-
13
-
14
-
15
-
16
-
 17
17 -
 18
18 -
 19
19 -
 20
20 -
 21
21 -
 22
22 -
 23
23 -
 24
24 -
 25
25 -
 26
26 -
 27
27 -
 28
28 -
 29
29 -
 30
30 -
 31
31 -
 32
32 -
 33
33 -
 34
34 -
 35
35 -
 36
36 -
 37
37 -
38
-
39
-
40
-
41
-
42
-
43
-
44
-
45
-
46
-
47
-
48
-
49
-
50
-
51
-
52
-
53
-
54
-
55
-
56
-
57
-
58
-
59
-
60
-
61
-
62
-
63
-
64
-
65
-
66
-
67
-
68
-
69
-
70
-
71
-
72
-
73
-
74
-
75
-
76
-
77
-
78
-
79
-
80
-
81
-
82
-
83
-
84
-
85
 |
 |
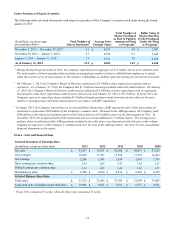
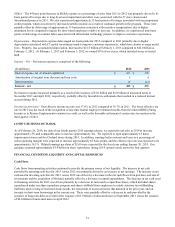
19
(In millions, except percentage data)
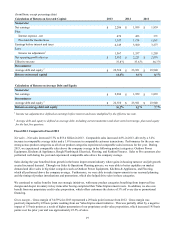
Calculation of Return on Invested Capital
2013
2012
2011
Numerator
Net earnings
$
2,286
$
1,959
$
1,839
Plus:
Interest expense - net
476
423
371
Provision for income taxes
1,387
1,178
1,067
Earnings before interest and taxes
4,149
3,560
3,277
Less:
Income tax adjustment 1
1,567
1,337
1,203
Net operating profit after tax
$
2,582
$
2,223
$
2,074
Effective tax rate
37.8
%
37.6
%
36.7
%
Denominator
Average debt and equity 2
$
22,510
$
23,921
$
23,940
Return on invested capital
11.5
%
9.3
%
8.7
%
Calculation of Return on Average Debt and Equity
Numerator
Net earnings
$
2,286
$
1,959
$
1,839
Denominator
Average debt and equity 2
$
22,510
$
23,921
$
23,940
Return on average debt and equity
10.2
%
8.2
%
7.7
%
1 Income tax adjustment is defined as earnings before interest and taxes multiplied by the effective tax rate.
2 Average debt and equity is defined as average debt, including current maturities and short-term borrowings, plus total equity
for the last five quarters.
Fiscal 2013 Compared to Fiscal 2012
Net sales – Net sales increased 5.7% to $53.4 billion in 2013. Comparable sales increased 4.8% in 2013, driven by a 3.2%
increase in comparable average ticket and a 1.6% increase in comparable customer transactions. Performance for the year was
strong across product categories as all of our product categories experienced comparable sales increases for the year. During
2013, we experienced comparable sales above the company average in the following product categories: Outdoor Power
Equipment, Kitchens & Appliances, Rough Plumbing & Electrical, Flooring, and Fashion Fixtures. Sales to Pro customers also
performed well during the year and experienced comparable sales above the company average.
Sales during the year benefited from growth in the home improvement industry where gains in housing turnover and job growth
created increased demand. Through our Sales & Operations Planning process, we were able to better capitalize on market
demand and drive sales in big ticket categories such as Outdoor Power Equipment, Kitchens & Appliances, and Flooring,
which all performed above the company average. Furthermore, we were able to make improvements in our seasonal planning
and the timing of product introductions and promotions, which also helped drive sales in these categories.
We continued to realize benefits from our strategic initiatives, with many product categories benefiting from improved line
designs and deeper inventory in key items after having completed their Value Improvement resets. In addition, we also saw
benefit from our proprietary credit value proposition, which offers customers the choice of 5% off every day or promotional
financing.
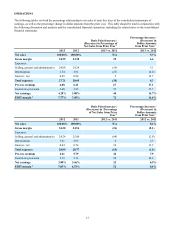
Gross margin – Gross margin of 34.59% for 2013 represented a 29 basis point increase from 2012. Gross margin was
positively impacted by 45 basis points resulting from our Value Improvement initiative. This was partially offset by a negative
impact of 15 basis points as a result of higher penetration of our proprietary credit value proposition, which increased 145 basis
points over the prior year and was approximately 25.5% of sales.