Proctor and Gamble 1999 Annual Report Download - page 22
Download and view the complete annual report
Please find page 22 of the 1999 Proctor and Gamble annual report below. You can navigate through the pages in the report by either clicking on the pages listed below, or by using the keyword search tool below to find specific information within the annual report.-
 1
1 -
2
-
3
-
4
-
5
-
6
-
7
-
8
-
9
-
10
-
11
-
 12
12 -
 13
13 -
 14
14 -
 15
15 -
 16
16 -
 17
17 -
 18
18 -
 19
19 -
 20
20 -
 21
21 -
 22
22 -
 23
23 -
 24
24 -
 25
25 -
 26
26 -
 27
27 -
 28
28 -
 29
29 -
 30
30 -
 31
31 -
 32
32 -
33
-
34
-
35
-
36
-
37
-
38
-
39
-
40
-
41
-
42
-
43
-
44
-
45
-
46
-
47
-
48
-
49
-
50
-
51
-
52
-
53
-
54
 |
 |

FINANCIAL REVIEW (CONTINUED)
18
The Procter & Gamble Company and Subsidiaries
Central and Eastern Europe’s unit volume
slid 16%, reflecting the 75% devaluation of the
Russian ruble and the resulting disruptions in
neighboring economies. Despite the contraction
in consumption, Russia and Central and Eastern
Europe either maintained or further improved
leading market share positions. Current year
earnings fell substantially as a result of the
crisis. In the prior year, volume grew by double
digits, and earnings improved versus 1997.
The strong volume and earnings performance in
the prior year reflected leverage in cost manage-
ment and efficiency gained from expansion into
emerging markets.
ASIA REGION
The Asia region showed some signs of emergence
from the currency crisis, as the Asian economy
began to stabilize and consumer markets began
to recover.
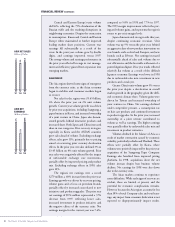
Net sales for the region were $3.65 billion,
6% above the prior year on 2% unit volume
growth. Current year volume growth was driven
by prior year acquisitions, including Ssangyong, a
paper business in Korea, and increased ownership
of a joint venture in China. Japan also demon-
strated growth, behind innovative products and
increased share. Both Japan and China increased
share in core categories. Price recovery strategies,
especially in Korea and the ASEAN countries
grew sales ahead of volume. Excluding exchange
effects, sales grew 11%, primarily due to pricing
aimed at recovering prior currency devaluation
effects. In the prior year, net sales declined 3% to
$3.45 billion on 4% unit volume growth. Prior
year sales were negatively affected by the impact
of unfavorable exchange rate movements,
partially offset by improved pricing and product
mix. Excluding exchange effects in 1998, sales
grew 10%.
The region’s net earnings were a record
$279 million, a 60% increase from the prior year.
Earnings growth was driven by recovery pricing,
volume gains and a focus on premium brands,
partially offset by increased costs related to new
initiatives and product upgrades. The prior year
net earnings of $174 million represented a 37%
decrease from 1997, reflecting lower sales,
increased investment in product initiatives and
the negative effects of the currency crisis. Net
earnings margin for the current year was 7.6%,
compared to 5.0% in 1998 and 7.7% in 1997.
The 1999 margin improvement reflects the pric-
ing and volume gains, and represents the region’s
return to pre-crisis margin levels.
Japan demonstrated strong results this year,
despite continuing economic recession. Unit
volume was up 9% versus the prior year, behind
an aggressive slate of new product innovations on
core brands, such as Ariel and Pampers, and new
brands, such as Febreze. Net earnings increased
substantially ahead of sales and volume due to
cost efficiencies and the favorable settlement of a
patent litigation dispute. Prior year results reflected
relatively flat volume as a result of the difficult
Japanese economy. Earnings were lower in 1998
due to unfavorable sales mix, investment in new
products and a weak yen.
Greater China’s unit volume grew 5% versus
the prior year despite a deceleration in overall
market growth in the geography, given the diffi-
cult economic climate there. Volume gains were
driven by Taiwan and increased ownership of
joint ventures in China. Net earnings declined
under competitive pressure, a consumption tax
on hair care products and continued investment
in product upgrades. In the prior year, increased
ownership of a joint venture contributed to
volume as well as earnings. The higher earnings
were partially offset by unfavorable sales mix and
investment in product initiatives.
Volumes declined in the balance of Asia as a
result of market contraction caused by economic
volatility, particularly in India and Thailand. These
effects were partially offset by Korea, where
volumes were positively impacted by the prior year
acquisition of the Ssangyong Paper Company.
Earnings also benefited from improved pricing
platforms. In 1998, acquisitions drove the net
volume increase despite base business volume
declines. Net earnings for 1998 were also down
due to the currency crisis.
The Asian markets continue to experience
some difficulties. While early signs of recovery are
evident, these are limited at present, and the
potential for economic complications remains.
However, because the Asia region accounts for less
than 10% of total Company sales and total earn-
ings, any impact from economic dislocation is not
expected to disproportionately impact results.
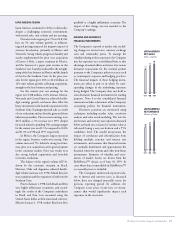
275
174
279
’97 ’98 ’99
ASIA NET
EARNINGS
Millions of Dollars
3.6
3.5
3.6
’97 ’98 ’99
ASIA NET SALES
Billions of Dollars