Proctor and Gamble 1999 Annual Report Download - page 45
Download and view the complete annual report
Please find page 45 of the 1999 Proctor and Gamble annual report below. You can navigate through the pages in the report by either clicking on the pages listed below, or by using the keyword search tool below to find specific information within the annual report.-
 1
1 -
2
-
3
-
4
-
5
-
6
-
7
-
8
-
9
-
10
-
11
-
12
-
13
-
14
-
15
-
16
-
17
-
18
-
19
-
20
-
21
-
22
-
23
-
24
-
25
-
26
-
27
-
28
-
29
-
30
-
31
-
32
-
33
-
34
-
 35
35 -
 36
36 -
 37
37 -
 38
38 -
 39
39 -
 40
40 -
 41
41 -
 42
42 -
 43
43 -
 44
44 -
 45
45 -
 46
46 -
 47
47 -
 48
48 -
 49
49 -
 50
50 -
 51
51 -
 52
52 -
 53
53 -
 54
54
 |
 |
Millions of Dollars Except Per Share Amounts
The Procter & Gamble Company and Subsidiaries
41
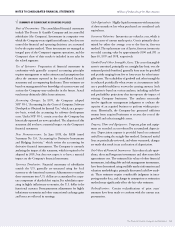
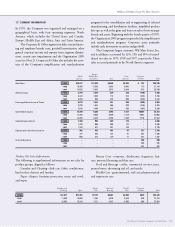
12 SEGMENT INFORMATION
In 1999, the Company was organized and managed on a
geographical basis, with four operating segments: North
America, which includes the United States and Canada;
Europe, Middle East and Africa; Asia; and Latin America.
The Corporate & Other segment includes certain financ-
ing and employee benefit costs, goodwill amortization, other
general corporate income and expense items, segment elimina-
tions, certain asset impairments and the Organization 2005
costs (see Note 2). Corporate & Other also includes the activ-
ities of the Company’s simplification and standardization
program for the consolidation and re-engineering of selected
manufacturing and distribution facilities, simplified product
line-ups, as well as the gains and losses on sales of non-strategic
brands and assets. Beginning with the fourth quarter of 1999,
the Organization 2005 program superseded the simplification
and standardization program. Corporate assets primarily
include cash, investment securities and goodwill.
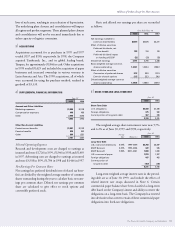
The Company’s largest customer, Wal-Mart Stores, Inc.
and its affiliates, accounted for 12%, 11% and 10% of consol-
idated net sales in 1999, 1998 and 1997, respectively. These
sales occurred primarily in the North America segment.
Europe,
North Middle East Latin Corporate
America and Africa Asia America & Other Total
Net Sales 1999 $18,977 $11,878 $3,648 $2,825 $ 797 $38,125
1998 18,456 11,835 3,453 2,640 770 37,154
1997 17,625 11,587 3,573 2,306 673 35,764
Net Earnings 1999 2,710 1,214 279 318 (758) 3,763
1998 2,474 1,092 174 274 (234) 3,780
1997 2,253 956 275 256 (325) 3,415
Earnings Before Income Taxes 1999 4,215 1,692 411 350 (830) 5,838
1998 3,789 1,540 266 329 (216) 5,708
1997 3,516 1,446 400 326 (439) 5,249
Identifiable Assets 1999 11,390 6,286 2,793 1,577 10,067 32,113
1998 11,063 5,998 2,499 1,519 9,887 30,966
1997 10,280 5,433 2,726 1,389 7,716 27,544
Capital Expenditures 1999 1,484 905 265 174 – 2,828
1998 1,433 686 266 174 – 2,559
1997 1,163 547 287 132 – 2,129
Depreciation and Amortization 1999 902 481 161 87 517 2,148
1998 731 345 144 91 287 1,598
1997 666 374 139 71 237 1,487
Interest Expense 1999 ––––650650
1998 ––––548548
1997 ––––457457
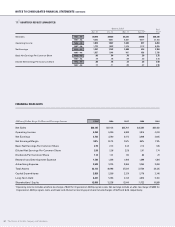
Product Net Sales Information
The following is supplemental information on net sales by
product groups, aligned as follows:
Laundry and Cleaning – dish care, fabric conditioners,
hard surface cleaners and laundry.
Paper – diapers, feminine protection, tissue and towel,
and wipes.
Beauty Care – cosmetics, deodorants, fragrances, hair
care, personal cleansing and skin care.
Food and Beverage – coffee, commercial services, juice,
peanut butter, shortening and oil, and snacks.
Health Care – gastrointestinal, oral care, pharmaceuticals
and respiratory care.
Laundry and Beauty Food and Health Corporate
Cleaning Paper Care Beverage Care & Other Total
1999 $11,517 $11,451 $7,115 $4,381 $2,836 $825 $38,125
1998 11,099 10,862 7,160 4,376 2,849 808 37,154
1997 10,892 10,101 7,101 4,107 2,895 668 35,764