Proctor and Gamble 1999 Annual Report Download - page 23
Download and view the complete annual report
Please find page 23 of the 1999 Proctor and Gamble annual report below. You can navigate through the pages in the report by either clicking on the pages listed below, or by using the keyword search tool below to find specific information within the annual report.-
 1
1 -
2
-
3
-
4
-
5
-
6
-
7
-
8
-
9
-
10
-
11
-
12
-
 13
13 -
 14
14 -
 15
15 -
 16
16 -
 17
17 -
 18
18 -
 19
19 -
 20
20 -
 21
21 -
 22
22 -
 23
23 -
 24
24 -
 25
25 -
 26
26 -
 27
27 -
 28
28 -
 29
29 -
 30
30 -
 31
31 -
 32
32 -
 33
33 -
34
-
35
-
36
-
37
-
38
-
39
-
40
-
41
-
42
-
43
-
44
-
45
-
46
-
47
-
48
-
49
-
50
-
51
-
52
-
53
-
54
 |
 |

The Procter & Gamble Company and Subsidiaries
19
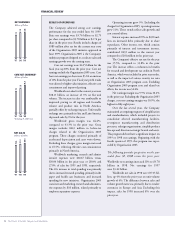
LATIN AMERICA REGION
Latin America continued to deliver solid results,
despite a challenging economic environment,
with record sales, unit volume and net earnings.
Net sales in the region grew 7% to $2.83 bil-
lion on 3% unit volume growth, as inflation-
targeted pricing outpaced the negative impact of
currency devaluation, primarily in Mexico and
Venezuela. Strong volume progress in laundry and
snacks supplemented the prior year acquisition
of Loreto y Peña, a paper company in Mexico,
and the buyout of a paper joint venture in the
Southern Cone. Laundry results reflect the strength-
ening of the base business in Mexico and the launch
of Ariel in the Southern Cone. In the prior year,
sales for the region grew 14% to $2.64 billion on
12% unit volume growth, reflecting acquisitions,
strength in the base business and pricing.
For the current year, net earnings for the
region were $318 million, a 16% increase. Mexico,
Venezuela and Central America achieved double-
digit earnings growth, and more than offset the
heavy investment in the laundry expansion in the
Southern Cone. Earnings surpassed sales as a result
of cost reductions and tax benefits generated from
inflationary markets. Prior year net earnings were
$274 million, a 7% increase over 1997, despite
increased initiative spending. Net earnings margin
for the current year was 11.3% compared to 10.4%
and 11.1% in 1998 and 1997, respectively.
In Mexico, the Company’s largest operation
in the region, business results were strong. Unit
volume increased 7%, behind a strong base busi-
ness, prior year acquisitions and a general upturn
in the consumer market. Prior year results were
also strong, behind acquisitions and favorable
economic conditions.
The balance of the region’s volume fell 1%,
driven by the economic situation in Brazil.
However, Chile and Argentina achieved double-
digit volume increases over 1998, behind the prior
year acquisition and the expansion of Ariel into the
Southern Cone.
Prior to January 1, 1998, both Brazil and Peru
were highly inflationary economies, and accord-
ingly, the results of the Company’s subsidiaries
in Brazil and Peru were measured using the
United States dollar as their functional currency.
Effective January 1, 1998, neither Brazil nor Peru
qualified as a highly inflationary economy. The
impact of this change was not material to the
Company’s earnings.
HEDGING AND DERIVATIVE
FINANCIAL INSTRUMENTS
The Company is exposed to market risk, includ-
ing changes in interest rates, currency exchange
rates and commodity prices. To manage the
volatility relating to these exposures, the Company
nets the exposures on a consolidated basis to take
advantage of natural offsets and enters into various
derivative transactions for the residual portion
pursuant to the Company’s policies in areas such
as counterparty exposure and hedging practices.
The financial impacts of these hedging instru-
ments are offset in part or in whole by corre-
sponding changes in the underlying exposures
being hedged. The Company does not hold or
issue derivative financial instruments for trading
purposes. Note 6 to the consolidated financial
statements includes a discussion of the Company’s
accounting policies for financial instruments.
Derivative positions are monitored using
techniques including market value, sensitivity
analysis and value at risk modeling. The tests for
interest rate and currency rate exposures discussed
below are based on a variance/co-variance value at
risk model using a one year horizon and a 95%
confidence level. The model incorporates the
impact of correlation and diversification from
holding multiple currency and interest rate
instruments, and assumes that financial returns
are normally distributed, and approximates the
financial return for options and other non-linear
instruments. Estimates of volatility and corre-
lations of market factors are drawn from the
RiskMetrics™ dataset as of June 30, 1999. In
cases where data is unavailable in RiskMetrics™
a reasonable proxy is included.
The Company’s market risk exposures rela-
tive to interest and currency rates, as discussed
below, have not changed materially versus the
previous reporting period. In addition, the
Company is not aware of any facts or circum-
stances that would significantly impact such
exposures in the near-term.
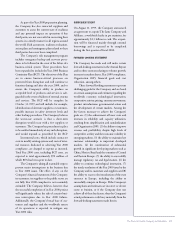
2.3
2.6
2.8
’97 ’98 ’99
LATIN AMERICA
NET SALES
Billions of Dollars
256
274
318
’97 ’98 ’99
LATIN AMERICA
NET EARNINGS
Millions of Dollars