Proctor and Gamble 1999 Annual Report Download - page 41
Download and view the complete annual report
Please find page 41 of the 1999 Proctor and Gamble annual report below. You can navigate through the pages in the report by either clicking on the pages listed below, or by using the keyword search tool below to find specific information within the annual report.-
 1
1 -
2
-
3
-
4
-
5
-
6
-
7
-
8
-
9
-
10
-
11
-
12
-
13
-
14
-
15
-
16
-
17
-
18
-
19
-
20
-
21
-
22
-
23
-
24
-
25
-
26
-
27
-
28
-
29
-
30
-
 31
31 -
 32
32 -
 33
33 -
 34
34 -
 35
35 -
 36
36 -
 37
37 -
 38
38 -
 39
39 -
 40
40 -
 41
41 -
 42
42 -
 43
43 -
 44
44 -
 45
45 -
 46
46 -
 47
47 -
 48
48 -
 49
49 -
 50
50 -
 51
51 -
52
-
53
-
54
 |
 |

The Procter & Gamble Company and Subsidiaries
37
Millions of Dollars Except Per Share Amounts
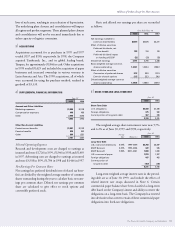
Currency instruments outstanding are as follows:
June 30
1999 1998
Notional amount
Forward contracts $1,988 $3,448
Purchased options 1,358 1,262
Currency swaps 33 217
Fair value
Forward contracts $ (6) $30
Purchased options 19 16
Currency swaps 58
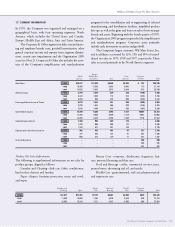
The reduction in the notional amount of forward
contracts reflects the introduction of the euro and increased
efficiencies in our hedge program. The deferred gains and
losses on these instruments were not material.
In addition, in order to hedge currency exposures related
to the net investments in foreign subsidiaries, the Company
utilizes local currency financing entered into by the
subsidiaries, and currency interest rate swaps and other foreign
currency denominated financing instruments entered into by
the parent. Gains and losses on instruments designated as
hedges of net investments are offset against the translation
effects reflected in shareholders’ equity.
Currency interest rate swaps, foreign currency instruments
and foreign currency denominated debt that have been desig-
nated as hedges of the Company’s net investment exposure in
certain foreign subsidiaries have notional amounts totaling
$826 and $1,138 at June 30, 1999 and 1998, respectively. These
hedges resulted in gains of $5 and $42, net of $4 and $25 in
tax effects, reflected in shareholders’ equity.
Credit Risk
Credit risk arising from the inability of a counterparty to meet
the terms of the Company’s financial instrument contracts is
generally limited to the amounts, if any, by which the coun-
terparty’s obligations exceed the obligations of the Company.
It is the Company’s policy to enter into financial instruments
with a diversity of creditworthy counterparties. Therefore, the
Company does not expect to incur material credit losses on its
risk management or other financial instruments.
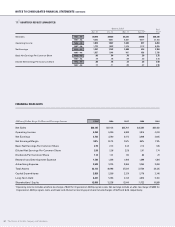
7STOCK OPTIONS
The Company has stock-based compensation plans under
which stock options are granted annually to key managers and
directors at the market price on the date of grant. The 1999
grants are fully exercisable after three years and have a fifteen
year life, while prior years’ grants are fully exercisable after one
year and have a ten year life. In 1998, the Company granted
stock options to all eligible employees not covered by the key
manager and director plans. These grants, which comprised
8.7 million of the 20.3 million options granted in 1998, are
fully exercisable after five years and have a ten year life. The
Company issues stock appreciation rights in countries where
stock options have not been approved by local governments.
Pursuant to FASB Statement No. 123, “Accounting for
Stock-Based Compensation,” the Company has elected to
account for its employee stock option plans under APB
Opinion No. 25, “Accounting for Stock Issued to
Employees.” Accordingly, compensation cost has not been
recognized for stock options issued under these plans. Had
compensation cost for the plans been determined based on
the fair value at the grant date consistent with FASB
Statement No. 123, the Company’s net earnings and earnings
per share would have been as follows:
Years Ended June 30
1999 1998 1997
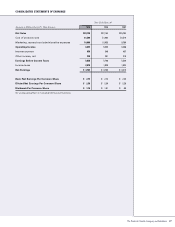
Net earnings
As reported $3,763 $3,780 $3,415
Pro forma 3,683 3,472 3,305
Net earnings per common share
Basic
As reported $ 2.75 $ 2.74 $ 2.43
Pro forma 2.69 2.51 2.35
Diluted
As reported 2.59 2.56 2.28
Pro forma 2.53 2.35 2.20
The fair value of each option grant is estimated on the
date of grant using a binomial option-pricing model with the
following weighted average assumptions:
Years Ended June 30
1999 1998 1997
Interest rate 5.4% 5.6% 6.6%
Dividend yield 1.5% 2% 2%
Expected volatility 26% 26% 22%
Expected life in years 766