Proctor and Gamble 1999 Annual Report Download - page 35
Download and view the complete annual report
Please find page 35 of the 1999 Proctor and Gamble annual report below. You can navigate through the pages in the report by either clicking on the pages listed below, or by using the keyword search tool below to find specific information within the annual report.-
 1
1 -
2
-
3
-
4
-
5
-
6
-
7
-
8
-
9
-
10
-
11
-
12
-
13
-
14
-
15
-
16
-
17
-
18
-
19
-
20
-
21
-
22
-
23
-
24
-
 25
25 -
 26
26 -
 27
27 -
 28
28 -
 29
29 -
 30
30 -
 31
31 -
 32
32 -
 33
33 -
 34
34 -
 35
35 -
 36
36 -
 37
37 -
 38
38 -
 39
39 -
 40
40 -
 41
41 -
 42
42 -
 43
43 -
 44
44 -
 45
45 -
46
-
47
-
48
-
49
-
50
-
51
-
52
-
53
-
54
 |
 |
The Procter & Gamble Company and Subsidiaries
31
The Procter & Gamble Company and Subsidiaries
31
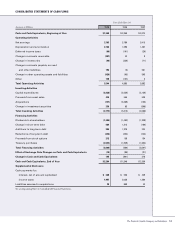
CONSOLIDATED STATEMENTS OF CASH FLOWS
Years Ended June 30
Amounts in Millions 1999 1998 1997
Cash and Cash Equivalents, Beginning of Year $ 1,549 $ 2,350 $ 2,074
Operating Activities
Net earnings 3,763 3,780 3,415
Depreciation and amortization 2,148 1,598 1,487
Deferred income taxes (60) (101) (26)
Change in accounts receivable (207) 42 8
Change in inventories (96) (229) (71)
Change in accounts payable, accrued
and other liabilities 792 (3) 561
Change in other operating assets and liabilities (926) (65) 503
Other 130 (137) 5
Total Operating Activities 5,544 4,885 5,882
Investing Activities
Capital expenditures (2,828) (2,559) (2,129)
Proceeds from asset sales 434 555 520
Acquisitions (137) (3,269) (150)
Change in investment securities 356 63 (309)
Total Investing Activities (2,175) (5,210) (2,068)
Financing Activities
Dividends to shareholders (1,626) (1,462) (1,329)
Change in short-term debt 689 1,315 (160)
Additions to long-term debt 986 1,970 224
Reductions of long-term debt (334) (432) (724)
Proceeds from stock options 212 158 134
Treasury purchases (2,533) (1,929) (1,652)
Total Financing Activities (2,606) (380) (3,507)
Effect of Exchange Rate Changes on Cash and Cash Equivalents (18) (96) (31)
Change in Cash and Cash Equivalents 745 (801) 276
Cash and Cash Equivalents, End of Year $ 2,294 $ 1,549 $ 2,350
Supplemental Disclosure
Cash payments for:
Interest, net of amount capitalized $ 640 $ 536 $ 449
Income taxes 1,957 2,056 1,380
Liabilities assumed in acquisitions 38 808 42
See accompanying Notes to Consolidated Financial Statements.