Proctor and Gamble 1999 Annual Report Download - page 32
Download and view the complete annual report
Please find page 32 of the 1999 Proctor and Gamble annual report below. You can navigate through the pages in the report by either clicking on the pages listed below, or by using the keyword search tool below to find specific information within the annual report.-
 1
1 -
2
-
3
-
4
-
5
-
6
-
7
-
8
-
9
-
10
-
11
-
12
-
13
-
14
-
15
-
16
-
17
-
18
-
19
-
20
-
21
-
 22
22 -
 23
23 -
 24
24 -
 25
25 -
 26
26 -
 27
27 -
 28
28 -
 29
29 -
 30
30 -
 31
31 -
 32
32 -
 33
33 -
 34
34 -
 35
35 -
 36
36 -
 37
37 -
 38
38 -
 39
39 -
 40
40 -
 41
41 -
 42
42 -
43
-
44
-
45
-
46
-
47
-
48
-
49
-
50
-
51
-
52
-
53
-
54
 |
 |

28
The Procter & Gamble Company and Subsidiaries
28
The Procter & Gamble Company and Subsidiaries
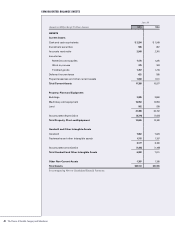
CONSOLIDATED BALANCE SHEETS
June 30
Amounts in Millions Except Per Share Amounts 1999 1998
ASSETS
Current Assets
Cash and cash equivalents $ 2,294 $ 1,549
Investment securities 506 857
Accounts receivable 2,940 2,781
Inventories
Materials and supplies 1,176 1,225
Work in process 375 343
Finished goods 1,787 1,716
Deferred income taxes 621 595
Prepaid expenses and other current assets 1,659 1,511
Total Current Assets 11,358 10,577
Property, Plant and Equipment
Buildings 3,885 3,660
Machinery and equipment 16,953 15,953
Land 562 539
21,400 20,152
Accumulated depreciation (8,774) (7,972)
Total Property, Plant and Equipment 12,626 12,180
Goodwill and Other Intangible Assets
Goodwill 7,062 7,023
Trademarks and other intangible assets 1,115 1,157
8,177 8,180
Accumulated amortization (1,355) (1,169)
Total Goodwill and Other Intangible Assets 6,822 7,011
Other Non-Current Assets 1,307 1,198
Total Assets $32,113 $30,966
See accompanying Notes to Consolidated Financial Statements.