Proctor and Gamble 2002 Annual Report Download - page 30
Download and view the complete annual report
Please find page 30 of the 2002 Proctor and Gamble annual report below. You can navigate through the pages in the report by either clicking on the pages listed below, or by using the keyword search tool below to find specific information within the annual report.-
 1
1 -
2
-
3
-
4
-
5
-
6
-
7
-
8
-
9
-
10
-
11
-
12
-
13
-
14
-
15
-
16
-
17
-
18
-
19
-
 20
20 -
 21
21 -
 22
22 -
 23
23 -
 24
24 -
 25
25 -
 26
26 -
 27
27 -
 28
28 -
 29
29 -
 30
30 -
 31
31 -
 32
32 -
 33
33 -
 34
34 -
 35
35 -
 36
36 -
 37
37 -
 38
38 -
 39
39 -
 40
40 -
41
-
42
-
43
-
44
-
45
-
46
-
47
-
48
-
49
-
50
-
51
-
52
 |
 |

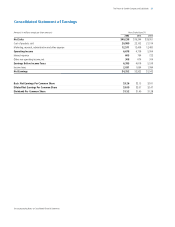
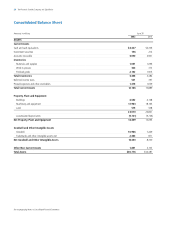
28 The Procter & Gamble Company and Subsidiaries
Consolidated Balance Sheet
June 30
Amounts in millions
ASSETS
Current Assets
Cash and cash equivalents
Investment securities
Accounts receivable
Inventories
Materials and supplies
Work in process
Finished goods
Total Inventories
Deferred income taxes
Prepaid expenses and other receivables
Total Current Assets
Property, Plant and Equipment
Buildings
Machinery and equipment
Land
Accumulated depreciation
Net Property, Plant and Equipment
Goodwill and Other Intangible Assets
Goodwill
Trademarks and other intangible assets, net
Net Goodwill and Other Intangible Assets
Other Non-Current Assets
Total Assets
2002 2001
$2,306
212
2,931
1,096
373
1,915
3,384
397
1,659
10,889
4,148
18,165
508
22,821
(9,726)
13,095
7,429
871
8,300
2,103
$34,387
$3,427
196
3,090
1,031
323
2,102
3,456
521
1,476
12,166
4,532
17,963
575
23,070
(9,721)
13,349
10,966
2,464
13,430
1,831
$ 40,776
See accompanying Notes to Consolidated Financial Statements