Proctor and Gamble 2002 Annual Report Download - page 43
Download and view the complete annual report
Please find page 43 of the 2002 Proctor and Gamble annual report below. You can navigate through the pages in the report by either clicking on the pages listed below, or by using the keyword search tool below to find specific information within the annual report.-
 1
1 -
2
-
3
-
4
-
5
-
6
-
7
-
8
-
9
-
10
-
11
-
12
-
13
-
14
-
15
-
16
-
17
-
18
-
19
-
20
-
21
-
22
-
23
-
24
-
25
-
26
-
27
-
28
-
29
-
30
-
31
-
32
-
 33
33 -
 34
34 -
 35
35 -
 36
36 -
 37
37 -
 38
38 -
 39
39 -
 40
40 -
 41
41 -
 42
42 -
 43
43 -
 44
44 -
 45
45 -
 46
46 -
 47
47 -
 48
48 -
 49
49 -
 50
50 -
 51
51 -
 52
52
 |
 |

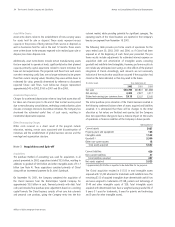
41The Procter & Gamble Company and Subsidiaries
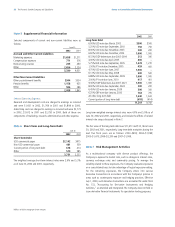
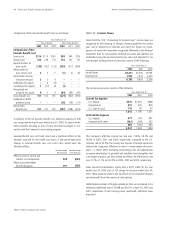
The following table sets forth the aggregate change in plan assets:
Pension plan assets are comprised of a diversified mix of assets
including corporate equities, government securities and corporate debt
securities. Other retiree assets are comprised of Company stock, net of
Series B ESOP debt, of $2,243 and $1,335, as of June 30, 2002 and
2001, respectively.
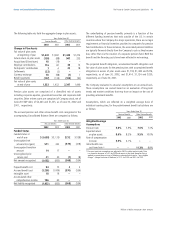
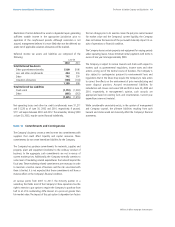
The accrued pension and other retiree benefit costs recognized in the
accompanying Consolidated Balance Sheet are computed as follows:
The underfunding of pension benefits primarily is a function of the
different funding incentives that exist outside of the U.S. In certain
countries where the Company has major operations, there are no legal
requirements or financial incentives provided to companies for pension
fund contributions. In these instances, the associated pension liabilities
are typically financed directly from the Company’s cash as they become
due, rather than via the creation of a separate pension fund. Both the
benefit and the financing costs have been reflected in net earnings.
The projected benefit obligation, accumulated benefit obligation and
fair value of plan assets for the pension plans with accumulated benefit
obligations in excess of plan assets were $1,718, $1,385 and $276,
respectively, as of June 30, 2002, and $1,414, $1,124 and $230,
respectively, as of June 30, 2001.
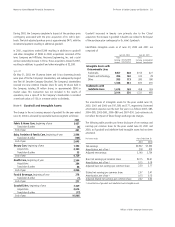
The Company evaluates its actuarial assumptions on an annual basis.
These assumptions are revised based on an evaluation of long-term
trends and market conditions that may have an impact on the cost of
providing retirement benefits.
Assumptions, which are reflected on a weighted average basis of
individual country plans, for the postretirement benefit calculations are
as follows:
Notes to Consolidated Financial Statements
Millions of dollars except per share amounts
Years Ended June 30
Other Retiree Benefits
Pension Benefits
Change in Plan Assets
Fair value of plan assets
at beginning of year
Actual return on plan assets
Acquisitions/(Divestitures)
Employer contributions
Participants’ contributions
Settlements
Currency exchange
Benefit payments
Fair value of plan assets
at end of year
$1,432
(150)
18
116
7
(22)
78
(147)
1,332
$1,691
(88)
(19)
81
4
(3)
(98)
(136)
1,432
$1,449
947
–
38
22
–
(1)
(108)
2,347
$1,274
235
–
14
18
–
1
(93)
1,449
2002 2001
2002 2001
Years Ended June 30
Other Retiree Benefits
Pension Benefits
2002
Funded Status
Funded status at
end of year
Unrecognized net
actuarial loss (gain)
Unrecognized transition
amount
Unrecognized prior
service cost
Net amount recognized
Prepaid benefit cost
Accrued benefit cost
Intangible asset
Accumulated other
comprehensive income
Net liability recognized
$(1,638)
571
14
21
(1,032)
94
(1,250)
18
106
(1,032)
$(1,135)
243
17
20
(855)
75
(1,006)
16
60
(855)
$212
(579)
–
(1)
(368)
2
(370)
–
–
(368)
$(128)
(418)
–
(8)
(554)
2
(556)
–
–
(554)
2001
2002 2001
2001
2002
Weighted Average
Assumptions
Discount rate
Expected return
on plan assets
Rate of compensation
increase
Initial health care
cost trend rate (1)
Years Ended June 30
5.9%
8.3%
4.1%
–
7.3%
10.0%
–
8.8%
5.6%
8.6%
3.5%
–
7.0%
9.5%
–
11.3%
Pension Benefits Other Retiree Benefits
(1) Five year trend rate assumption was adjusted in 2002 to reflect market trends. Rate
is assumed to decrease to 5.0% by 2009 and remain at that level thereafter. Rate is
applied to current plan costs net of Medicare; estimated initial rate for “gross eligible
charges” (charges inclusive of Medicare) is 9.1% for 2002 and 8.0% for 2001.
2002 2001