Proctor and Gamble 2002 Annual Report Download - page 4
Download and view the complete annual report
Please find page 4 of the 2002 Proctor and Gamble annual report below. You can navigate through the pages in the report by either clicking on the pages listed below, or by using the keyword search tool below to find specific information within the annual report.-
 1
1 -
 2
2 -
 3
3 -
 4
4 -
 5
5 -
 6
6 -
 7
7 -
 8
8 -
 9
9 -
 10
10 -
 11
11 -
 12
12 -
 13
13 -
 14
14 -
 15
15 -
16
-
17
-
18
-
19
-
20
-
21
-
22
-
23
-
24
-
25
-
26
-
27
-
28
-
29
-
30
-
31
-
32
-
33
-
34
-
35
-
36
-
37
-
38
-
39
-
40
-
41
-
42
-
43
-
44
-
45
-
46
-
47
-
48
-
49
-
50
-
51
-
52
 |
 |

2
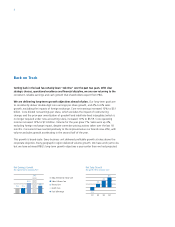
Back on Track
Getting back in the lead has certainly been “Job One” over the past two years. With clear
strategic choices, operational excellence and financial discipline, we are now returning to the
consistent, reliable earnings and cash growth that shareholders expect from P&G.
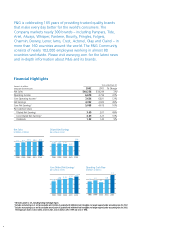
We are delivering long-term growth objectives ahead of plan. Our long-term goals are
to consistently deliver double-digit core earnings-per-share growth, and 4% to 6% sales
growth, excluding the impacts of foreign exchange. Core net earnings increased 10% to $5.1
billion. Core diluted net earnings-per-share, which excludes the impact of restructuring charges
and the prior-year amortization of goodwill and intangibles (which is no longer required under
new accounting rules), increased 10% to $3.59. Core operating income increased 12% to
$7.6 billion. Volume for the year grew 7%. Sales were up 4%, excluding foreign exchange
impact, despite corrective pricing actions taken over the last 18 months. Consumers have
reacted positively to the improved value our brands now offer, with volume and sales growth
accelerating in the second half of the year.
This growth is broad-scale. Every business unit delivered profitable growth at rates above the
corporate objective. Every geographic region delivered volume growth. We have work yet to do,
but we have achieved P&G’s long-term growth objectives a year earlier than we had projected.
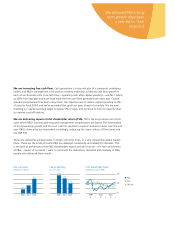
Baby, Feminine & Family Care
Fabric & Home Care
Beauty Care
Health Care
Food & Beverage
Earnings Growth
(by segment versus previous year)
11% 11%
22%
34%
16%
Sales Growth
(by quarter versus previous year)
Q1 Q2 Q3 Q4
4%
2%
6%
-2%
Getting back in the lead has certainly been “Job One” over the past two years. With clear
strategic choices, operational excellence and financial discipline, we are now returning to the
consistent, reliable earnings and cash growth that shareholders expect from P&G.
We are delivering long-term growth objectives ahead of plan. Our long-term goals are
to consistently deliver double-digit core earnings per share growth, and 4% to 6% sales
growth, excluding the impacts of foreign exchange. Core net earnings increased 10% to $5.1
billion. Core diluted net earnings per share, which excludes the impact of restructuring
charges and the prior-year amortization of goodwill and indefinite-lived intangibles (which is
no longer required under new accounting rules), increased 10% to $3.59. Core operating
income increased 12% to $7.6 billion. Volume for the year grew 7%. Sales were up 4%,
excluding foreign exchange impact, despite corrective pricing actions taken over the last 18
months. Consumers have reacted positively to the improved value our brands now offer, with
volume and sales growth accelerating in the second half of the year.
This growth is broad-scale. Every business unit delivered profitable growth at rates above the
corporate objective. Every geographic region delivered volume growth. We have work yet to do,
but we have achieved P&G’s long-term growth objectives a year earlier than we had projected.
Baby, Feminine & Family Care
Fabric & Home Care
Beauty Care
Health Care
Food & Beverage
Net Earnings Growth
(by segment versus previous year)
11% 11%
22%
34%
16%
Net Sales Growth
(by quarter versus previous year)
Q1 Q2 Q3 Q4
4%
2%
6%
-2%