Proctor and Gamble 2002 Annual Report Download - page 32
Download and view the complete annual report
Please find page 32 of the 2002 Proctor and Gamble annual report below. You can navigate through the pages in the report by either clicking on the pages listed below, or by using the keyword search tool below to find specific information within the annual report.-
 1
1 -
2
-
3
-
4
-
5
-
6
-
7
-
8
-
9
-
10
-
11
-
12
-
13
-
14
-
15
-
16
-
17
-
18
-
19
-
20
-
21
-
 22
22 -
 23
23 -
 24
24 -
 25
25 -
 26
26 -
 27
27 -
 28
28 -
 29
29 -
 30
30 -
 31
31 -
 32
32 -
 33
33 -
 34
34 -
 35
35 -
 36
36 -
 37
37 -
 38
38 -
 39
39 -
 40
40 -
 41
41 -
 42
42 -
43
-
44
-
45
-
46
-
47
-
48
-
49
-
50
-
51
-
52
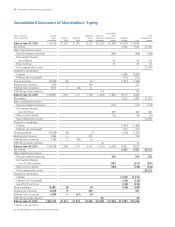
 |
 |

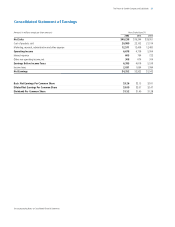
Balance June 30, 1999
Net earnings
Other comprehensive income:
Financial statement translation
Net investment hedges,
net of $88 tax
Other, net of tax
Total comprehensive income
Dividends to shareholders:
Common
Preferred, net of tax benefit
Treasury purchases
Employee plan issuances
Preferred stock conversions
ESOP debt guarantee reduction
Balance June 30, 2000
Net earnings
Other comprehensive income:
Financial statement translation
Net investment hedges,
net of $276 tax
Other, net of tax benefit
Total comprehensive income
Dividends to shareholders:
Common
Preferred, net of tax benefit
Treasury purchases
Employee plan issuances
Preferred stock conversions
ESOP debt guarantee reduction
Balance June 30, 2001
Net earnings
Other comprehensive income:
Financial statement translation
Net investment hedges,
net of $238 tax benefit
Other, net of tax benefit
Total comprehensive income
Dividends to shareholders:
Common
Preferred, net of tax benefit
Spin-off of Jif and Crisco
Treasury purchases
Employee plan issuances
Preferred stock conversions
ESOP debt guarantee reduction
Balance June 30, 2002
Dollars in millions/
Shares in thousands
Consolidated Statement of Shareholders’ Equity
(1) Premium on equity put options.
See accompanying Notes to Consolidated Financial Statements
$1,320
(24)
7
3
1,306
(18)
6
2
1,296
(8)
9
4
$1,301
Common
Stock
$1,781
(44)
1,737
(36)
1,701
(67)
$1,634
Preferred
Stock
$(1,552)
134
(1,418)
43
(1,375)
36
$(1,339)
Reserve for
ESOP Debt
Retirement
$(1,606)
(449)
150
63
(1,842)
(715)
460
(23)
(2,120)
263
(397)
(106)
$(2,360)
Accumulated
Other
Comprehensive
Income
$10,778
3,542
(1,681)
(115)
(1,814)
10,710
2,922
(1,822)
(121)
(1,238)
10,451
4,352
(1,971)
(124)
(150)
(578)
$11,980
Retained
Earnings
$12,058
3,542
(449)
150
63
(1,681)
(115)
(1,766)
351
–
134
12,287
2,922
(715)
460
(23)
(1,822)
(121)
(1,250)
229
–
43
12,010
4,352
263
(397)
(106)
(1,971)
(124)
(150)
(568)
361
–
36
$13,706
Total
$3,542
(449)
150
63
$3,306
$2,922
(715)
460
(23)
$2,644
$4,352
263
(397)
(106)
$4,112
Total
Comprehensive
Income
1,319,754
(24,296)
7,592
2,817
1,305,867
(18,238)
5,924
2,185
1,295,738
(7,681)
8,323
4,390
1,300,770
Common
Shares
Outstanding
$1,337
72
344
41
1,794
6
223
34
2,057
18
352
63
$2,490
Additional
Paid-In
Capital
(1)
(1)
(1)
30 The Procter & Gamble Company and Subsidiaries