Proctor and Gamble 2002 Annual Report Download - page 40
Download and view the complete annual report
Please find page 40 of the 2002 Proctor and Gamble annual report below. You can navigate through the pages in the report by either clicking on the pages listed below, or by using the keyword search tool below to find specific information within the annual report.-
 1
1 -
2
-
3
-
4
-
5
-
6
-
7
-
8
-
9
-
10
-
11
-
12
-
13
-
14
-
15
-
16
-
17
-
18
-
19
-
20
-
21
-
22
-
23
-
24
-
25
-
26
-
27
-
28
-
29
-
 30
30 -
 31
31 -
 32
32 -
 33
33 -
 34
34 -
 35
35 -
 36
36 -
 37
37 -
 38
38 -
 39
39 -
 40
40 -
 41
41 -
 42
42 -
 43
43 -
 44
44 -
 45
45 -
 46
46 -
 47
47 -
 48
48 -
 49
49 -
 50
50 -
51
-
52
 |
 |

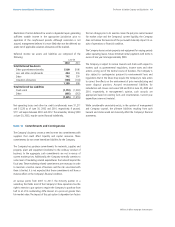
38 The Procter & Gamble Company and Subsidiaries
anticipated inventory purchases, the Company uses futures and options
with maturities generally less than one year and swap contracts
with maturities up to five years. These market instruments are
designated as cash flow hedges under SFAS No. 133. Accordingly, the
mark-to-market gain or loss on qualifying hedges is reported in OCI and
reclassified into cost of products sold in the same period or periods
during which the hedged transaction affects earnings. Qualifying cash
flow hedges currently recorded in OCI are not considered material. The
mark-to-market gain or loss on non-qualifying, excluded and ineffective
portions of hedges is immediately recognized in cost of products sold.
Commodity hedging activity was not material to the Company’s
financial statements for the years ended June 30, 2002 and 2001.
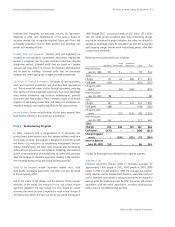
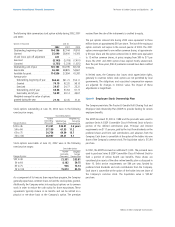
Note 8 Earnings Per Share and Stock Options
Net Earnings Per Common Share
Net earnings less preferred dividends (net of related tax benefits) are
divided by the weighted average number of common shares outstand-
ing during the year to calculate basic net earnings per common share.
Diluted net earnings per common share is calculated to give effect to
stock options and convertible preferred stock. The dilutive effect of
outstanding employee stock options is reflected by application of the
treasury stock method under SFAS No. 128, “Earnings per Share.”
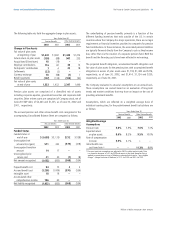
Basic and diluted net earnings per common share are as follows:
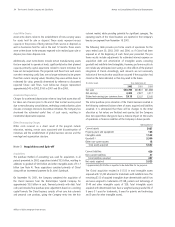
Stock-Based Compensation
The Company has stock-based compensation plans under which stock
options are granted annually to key managers and directors at the
market price on the date of grant. Grants were made under stock-based
compensation plans approved by shareholders in 1992 and 2001.
Grants issued since 1998 are fully exercisable after three years and
have a fifteen-year life, while prior years’ grants are fully exercisable
after one year and have a ten-year life.
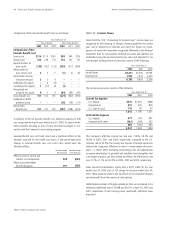
Pursuant to SFAS No. 123, “Accounting for Stock-Based Compensa-
tion,” the Company has elected to account for its employee stock
option plans under APB Opinion No. 25, “Accounting for Stock Issued to
Employees,” which recognizes expense based on intrinsic value at date
of grant. As stock options have been issued with exercise prices equal
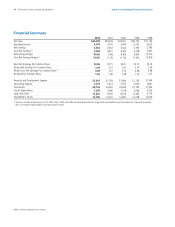
to grant date fair value, no compensation cost has resulted. Had
compensation cost for the plans been determined based on the fair
value at grant date consistent with SFAS No. 123, the Company’s net
earnings and earnings per common share would have been as follows:
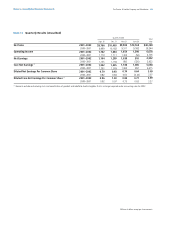
The fair value of grants issued in 2001 and 2000 was estimated using
the binomial options-pricing model. For options granted in 2002, the
Company has estimated the fair value of each grant using the more
widely recognized Black-Scholes option-pricing model. Assumptions are
evaluated annually and revised, as necessary, to reflect market condi-
tions and additional experience. The following assumptions were used:
Notes to Consolidated Financial Statements
Millions of dollars except per share amounts
2002
Net earnings available to
common shareholders
Preferred dividends, net
of tax benefit
Preferred dividend impact on
funding of ESOP (see Note 9)
Diluted net earnings
$4,228
124
(12)
4,340
Shares in millions
Basic weighted average common
shares outstanding
Conversion of preferred shares (1)
Exercise of stock options (2)
Diluted weighted average common
shares outstanding
1,297.4
88.8
18.7
1,404.9
$2,801
121
(15)
2,907
1,300.3
91.9
13.4
1,405.6
$3,427
115
(18)
3,524
1,313.2
94.3
19.7
1,427.2
Years Ended June 30
(1) Despite being included currently in diluted net earnings per common share, the actual
conversion to common stock occurs pursuant to the repayment of the ESOP debt over
a period exceeding 20 years.
(2) Approximately 36 million in 2002, 38 million in 2001 and 17 million in 2000 of the
Company’s outstanding stock options were not included in the diluted net earnings
per common share calculation because to do so would have been antidilutive (i.e.,
the exercise price exceeded market value.)
Years Ended June 30
20002001
2002 2000
2001
2002
5.4%
2.2%
20%
12
5.8%
2.0%
26%
9
6.0%
1.5%
28%
9
Interest rate
Dividend yield
Expected volatility
Expected life in years
Years Ended June 30 Options Granted
2001 2000
Years Ended June 30
Net Earnings
As reported
Pro forma
Net Earnings Per Common Share
Basic
As reported
Pro forma
Diluted
As reported
Pro forma
$4,352
3,910
$3.26
2.92
3.09
2.77
$2,922
2,612
$2.15
1.92
2.07
1.85
$3,542
3,363
$2.61
2.47
2.47
2.34
2002 2000
2001