Proctor and Gamble 2002 Annual Report Download - page 5
Download and view the complete annual report
Please find page 5 of the 2002 Proctor and Gamble annual report below. You can navigate through the pages in the report by either clicking on the pages listed below, or by using the keyword search tool below to find specific information within the annual report.-
 1
1 -
 2
2 -
 3
3 -
 4
4 -
 5
5 -
 6
6 -
 7
7 -
 8
8 -
 9
9 -
 10
10 -
 11
11 -
 12
12 -
 13
13 -
 14
14 -
 15
15 -
 16
16 -
17
-
18
-
19
-
20
-
21
-
22
-
23
-
24
-
25
-
26
-
27
-
28
-
29
-
30
-
31
-
32
-
33
-
34
-
35
-
36
-
37
-
38
-
39
-
40
-
41
-
42
-
43
-
44
-
45
-
46
-
47
-
48
-
49
-
50
-
51
-
52
 |
 |

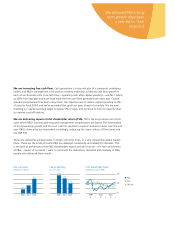
We are increasing free cash flow. Cash generation is a key indicator of a company’s underlying
health, and P&G’s management is focused on creating leadership, sustained cash flow growth in
each of our business units. Free cash flow – operating cash after capital spending – was $6.1 billion,
up 83% from last year and more than triple the free cash flow generated two years ago. Capital
spending improvement has been a key driver. Our objective was to reduce capital spending to 6%
of sales by fiscal 2004, and we’ve exceeded that goal two years ahead of schedule. We are now
resetting our capital spending target to below 5% of sales, and continue to look for opportunities
to improve asset efficiencies.
We are delivering superior total shareholder return (TSR). TSR is the key business unit metric
upon which P&G’s business planning and management compensation are based. The combination
of strong earnings growth and focus on cash has resulted in superior business returns over the past
year. P&G’s share price has responded accordingly, outpacing the major indices of Dow Jones and
the S&P 500.
These are substantial achievements, in tough economic times, in a very competitive global market-
place. These are the kinds of results P&G has delivered consistently and reliably for decades. This
is the level of performance that P&G shareholders expect and also that we – the men and women
of P&G – expect of ourselves. I want to commend the dedication, discipline and creativity of P&G
people who delivered these results.
We achieved P&G’s long-
term growth objectives
a year earlier than
projected.
Free Cash Flow
(in billions of dollars)
2000 2001 2002
Capital Spending
(as % of sales)
2000 2001 2002
P&G
DJIA
S&P 500
7.6%
6.3%
4.2%
Total Shareholder Return
(indexed versus July 1999)
1999 2000 2001
JDJDJDJ
50
100
150
1.7
3.3
6.1
Free Cash Flow
(in billions of dollars)
2000 2001 2002
Capital Spending
(as % of sales)
2000 2001 2002
P&G
DJIA
S&P 500
7.6%
6.3%
4.2%
Total Shareholder Return
(indexed versus July 1999)
1999 2000 2001
JDJDJDJ
50
100
150
1.7
3.3
6.1