Proctor and Gamble 2002 Annual Report Download - page 41
Download and view the complete annual report
Please find page 41 of the 2002 Proctor and Gamble annual report below. You can navigate through the pages in the report by either clicking on the pages listed below, or by using the keyword search tool below to find specific information within the annual report.-
 1
1 -
2
-
3
-
4
-
5
-
6
-
7
-
8
-
9
-
10
-
11
-
12
-
13
-
14
-
15
-
16
-
17
-
18
-
19
-
20
-
21
-
22
-
23
-
24
-
25
-
26
-
27
-
28
-
29
-
30
-
 31
31 -
 32
32 -
 33
33 -
 34
34 -
 35
35 -
 36
36 -
 37
37 -
 38
38 -
 39
39 -
 40
40 -
 41
41 -
 42
42 -
 43
43 -
 44
44 -
 45
45 -
 46
46 -
 47
47 -
 48
48 -
 49
49 -
 50
50 -
 51
51 -
52
 |
 |

39The Procter & Gamble Company and Subsidiaries
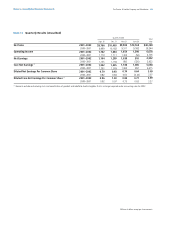
The following table summarizes stock option activity during 2002, 2001
and 2000:
Stock options outstanding at June 30, 2002 were in the following
exercise price ranges:
Stock options exercisable at June 30, 2002 were in the following
exercise price ranges:
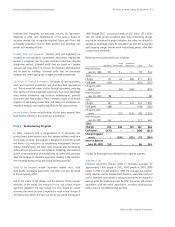
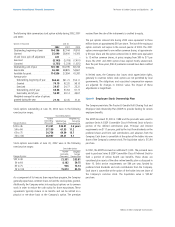
As a component of its treasury share repurchase program, the Company
generally repurchases common shares to fund the stock options granted.
Additionally, the Company enters into equity put options on its common
stock in order to reduce the cash outlay for share repurchases. These
agreements typically mature in six months and can be settled on a
physical or net-share basis at the Company’s option. The premium
received from the sale of the instruments is credited to equity.
The put options entered into during 2002 were equivalent to three
million shares at approximately $81 per share. The last of the equity put
option contracts will expire in the second quarter of 2003. The 2001
options were equivalent to one million common shares, at approximate-
ly $74 per share and the options entered into in 2000 were equivalent
to 12 million common shares, at prices ranging from $60 to $71 per
share. The 2001 and 2000 options have expired mostly unexercised.
Over the past three years, $96 of premiums received have been credited
to equity.
In limited cases, the Company also issues stock appreciation rights,
generally in countries where stock options are not permitted by local
governments. The obligations and associated compensation expense
are adjusted for changes in intrinsic value. The impact of these
adjustments is insignificant.
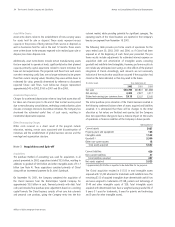
Note 9 Employee Stock Ownership Plan
The Company maintains The Procter & Gamble Profit Sharing Trust and
Employee Stock Ownership Plan (ESOP) to provide funding for certain
employee benefits.
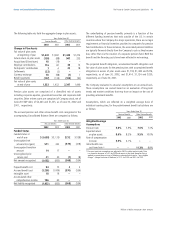
The ESOP borrowed $1,000 in 1989 and the proceeds were used to
purchase Series A ESOP Convertible Class A Preferred Stock to fund a
portion of the defined contribution plan. Principal and interest
requirements are $117 per year, paid by the trust from dividends on the
preferred shares and from cash contributions and advances from the
Company. Each share is convertible at the option of the holder into one
share of the Company’s common stock. The liquidation value is $13.64
per share.
In 1991, the ESOP borrowed an additional $1,000. The proceeds were
used to purchase Series B ESOP Convertible Class A Preferred Stock to
fund a portion of retiree health care benefits. These shares are
considered plan assets of the other retiree benefits plan as discussed in
Note 10. Debt service requirements are $94 per year, funded by
preferred stock dividends and cash contributions from the Company.
Each share is convertible at the option of the holder into one share of
the Company’s common stock. The liquidation value is $25.92
per share.
Number
Outstanding
(Thousands)
Weighted Avg.
Remaining
Contractual Life
25 to 46
54 to 64
65 to 75
76 to 106
21,331
37,139
24,756
36,937
$33.81
61.35
69.39
89.21
2.6 years
11.2
13.7
9.1
Weighted Avg.
Exercise Price
Outstanding Options
$
Range of prices
$33.81
59.75
73.14
85.76
Exercisable Options
Number
Exercisable
(Thousands)
Weighted
Average
Exercise Price
25 to 46
54 to 64
65 to 75
76 to 106
21,331
8,182
946
15,873
$
Range of prices
Notes to Consolidated Financial Statements
Millions of dollars except per share amounts
Outstanding, beginning of year
Granted
Jif and Crisco spin-off adjustment
Exercised
Canceled
Outstanding, end of year
Exercisable
Available for grant
Average price
Outstanding, beginning of year
Granted
Exercised
Outstanding, end of year
Exercisable, end of year
Weighted average fair value of options
granted during the year
2002
104,196
25,040
811
(8,149)
(1,735)
120,163
46,332
114,536
82,744
28,400
–
(5,709)
(1,239)
104,196
48,805
27,994
$61.73
62.20
24.77
63.64
49.14
22.45
$63.64
70.19
29.07
66.68
56.99
21.14
76,810
14,360
–
(7,401)
(1,025)
82,744
54,667
41,387
$52.11
96.10
25.21
61.73
46.67
37.21
June 30Options in thousands
2001 2000