Safeway 1997 Annual Report Download - page 19
Download and view the complete annual report
Please find page 19 of the 1997 Safeway annual report below. You can navigate through the pages in the report by either clicking on the pages listed below, or by using the keyword search tool below to find specific information within the annual report.-
 1
1 -
2
-
3
-
4
-
5
-
6
-
7
-
8
-
 9
9 -
 10
10 -
 11
11 -
 12
12 -
 13
13 -
 14
14 -
 15
15 -
 16
16 -
 17
17 -
 18
18 -
 19
19 -
 20
20 -
 21
21 -
 22
22 -
 23
23 -
 24
24 -
 25
25 -
 26
26 -
 27
27 -
 28
28 -
 29
29 -
30
-
31
-
32
-
33
-
34
-
35
-
36
-
37
-
38
-
39
-
40
-
41
-
42
-
43
-
44
 |
 |
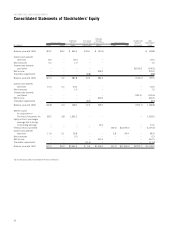
16
Stock Split
On January 28, 1998,
Safeway’s Board of Directors
authorized a two-for-one split of
the Company’s common stock.
The stock split was effected by
a distribution on February 25,
1998 of one additional share
for each share owned by stock-
holders of record on February
10, 1998. Share and per-share
amounts presented herein
have been restated to reflect
this stock split.
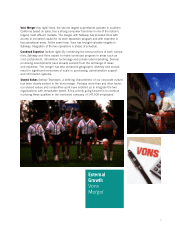
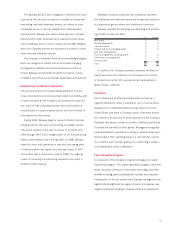
Merger with The Vons
Companies, Inc. (“Vons”)
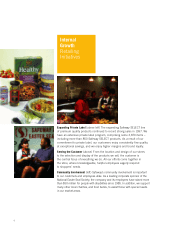
On April 8, 1997, Safeway
acquired Vons (the “Merger”).
Pursuant to the Merger, Safeway issued 83.2 million shares of
Safeway common stock for all of the Vons stock that Safeway
did not already own. Vons is now a wholly-owned subsidiary of
Safeway, and as of the beginning of the second quarter of
1997, Safeway’s consolidated financial statements include Vons’
financial results.
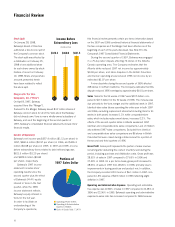
Results of Operations
Safeway’s net income was $557.4 million ($1.12 per share) in
1997, $460.6 million ($0.97 per share) in 1996, and $326.3
million ($0.68 per share) in 1995. In 1997 and 1995, income
before extraordinary items related to debt refinancings was
$621.5 million ($1.25 per share)
and $328.3 million ($0.68
per share), respectively.
Safeway’s 1997 income
statement includes Vons’
operating results since the
second quarter plus the effect
of Safeway’s 34.4% equity
interest in Vons in the first
quarter, while the 1996
income statement reflects
Safeway’s equity interest in
Vons for the full year.
In order to facilitate an
understanding of the
Company’s operations,
this financial review presents certain pro forma information based
on the 1997 and 1996 combined historical financial statements of
the two companies as if the Merger had been effective as of the
beginning of each of the years discussed. See Note B to the
Company’s 1997 Consolidated Financial Statements
During the second quarter of 1997, Safeway was engaged
in a 75-day labor dispute affecting 74 stores in the Alberta,
Canada operating area. The Company estimates that the
Alberta strike reduced 1997 net income by approximately
$0.04 per share, and labor disputes in the British Columbia
and Denver operating areas reduced 1996 net income by an
estimated $0.07 per share.
A nine-day strike during the second quarter of 1995 affected
208 stores in northern California. The Company estimates that this
dispute reduced 1995 earnings by approximately $0.01 per share.
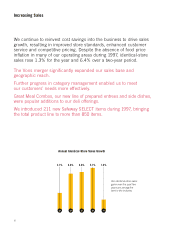
Sales Sales for the 53 weeks of 1997 were $22.5 billion com-
pared to $17.3 billion for the 52 weeks of 1996. The increase was
due primarily to the Vons merger and the additional week in 1997.
Identical-store sales (stores operating the entire year in both 1997
and 1996, excluding replacement stores but including Vons for 41
weeks in both years) increased 1.3% while comparable-store
sales, which includes replacement stores, increased 2.2%. The
effects of the second-quarter strike in Alberta weakened 1997
identical and comparable-store sales comparisons. Lack of inflation
also softened 1997 sales comparisons. Excluded from identical
and comparable-store sales comparisons are 86 stores in British
Columbia that were closed during a strike-lockout for a portion of
the second and third quarters of 1996.
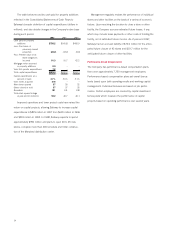
Gross Profit Gross profit represents the portion of sales revenue
remaining after deducting the costs of inventory sold during the
period, including purchase and distribution costs. Gross profit was
28.53% of sales in 1997 compared to 27.65% in 1996 and
27.40% in 1995. On a pro forma basis, gross profit increased to
28.63% of sales in 1997 from 28.20% in 1996, primarily due to
improvements in buying practices and product mix. In addition,
the Company recorded LIFO income of $6.1 million in 1997 com-
pared to LIFO expense of $4.9 million in 1996 reflecting slight
deflation in 1997.
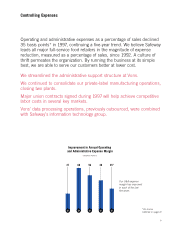
Operating and Administrative Expense Operating and administra-
tive expense was 22.84% of sales in 1997 compared to 22.48% in
1996 and 22.96% in 1995. Safeway’s operating and administrative
expense-to-sales ratio has increased compared to 1996 because
Financial Review
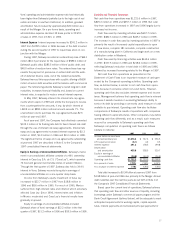
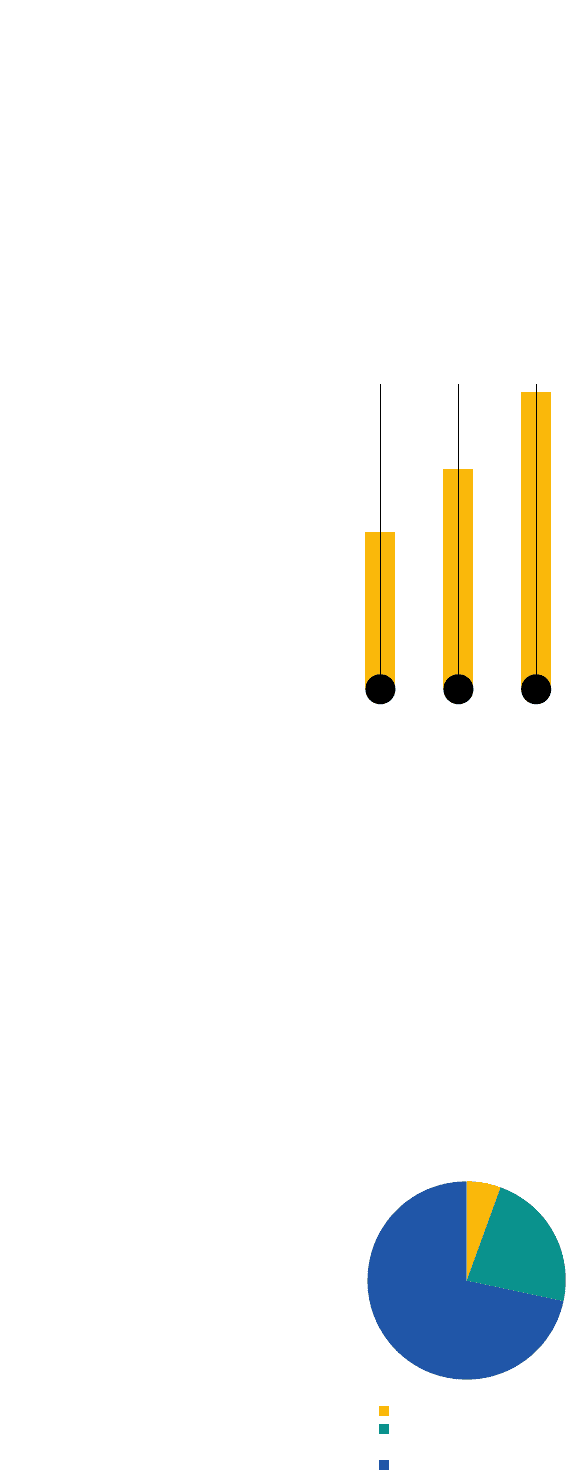
95 96 97
$328.3 $460.6 $621.5
Income Before
Extraordinary Loss
(IN MILLIONS)
Portions of
1997 Sales Dollar
Operating Profit: 5.69%
Operating & Administrative
Expense: 22.84%
Costs of Goods Sold: 71.47%