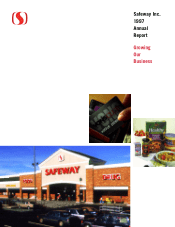
Safeway 1997 Annual Report Download - page 4
Download and view the complete annual report
Please find page 4 of the 1997 Safeway annual report below. You can navigate through the pages in the report by either clicking on the pages listed below, or by using the keyword search tool below to find specific information within the annual report.-
 1
1 -
 2
2 -
 3
3 -
 4
4 -
 5
5 -
 6
6 -
 7
7 -
 8
8 -
 9
9 -
 10
10 -
 11
11 -
 12
12 -
 13
13 -
 14
14 -
 15
15 -
16
-
17
-
18
-
19
-
20
-
21
-
22
-
23
-
24
-
25
-
26
-
27
-
28
-
29
-
30
-
31
-
32
-
33
-
34
-
35
-
36
-
37
-
38
-
39
-
40
-
41
-
42
-
43
-
44
 |
 |
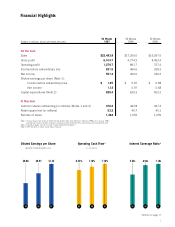
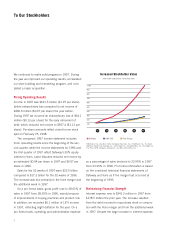
1
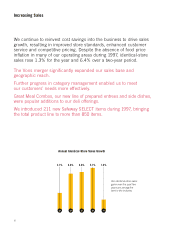
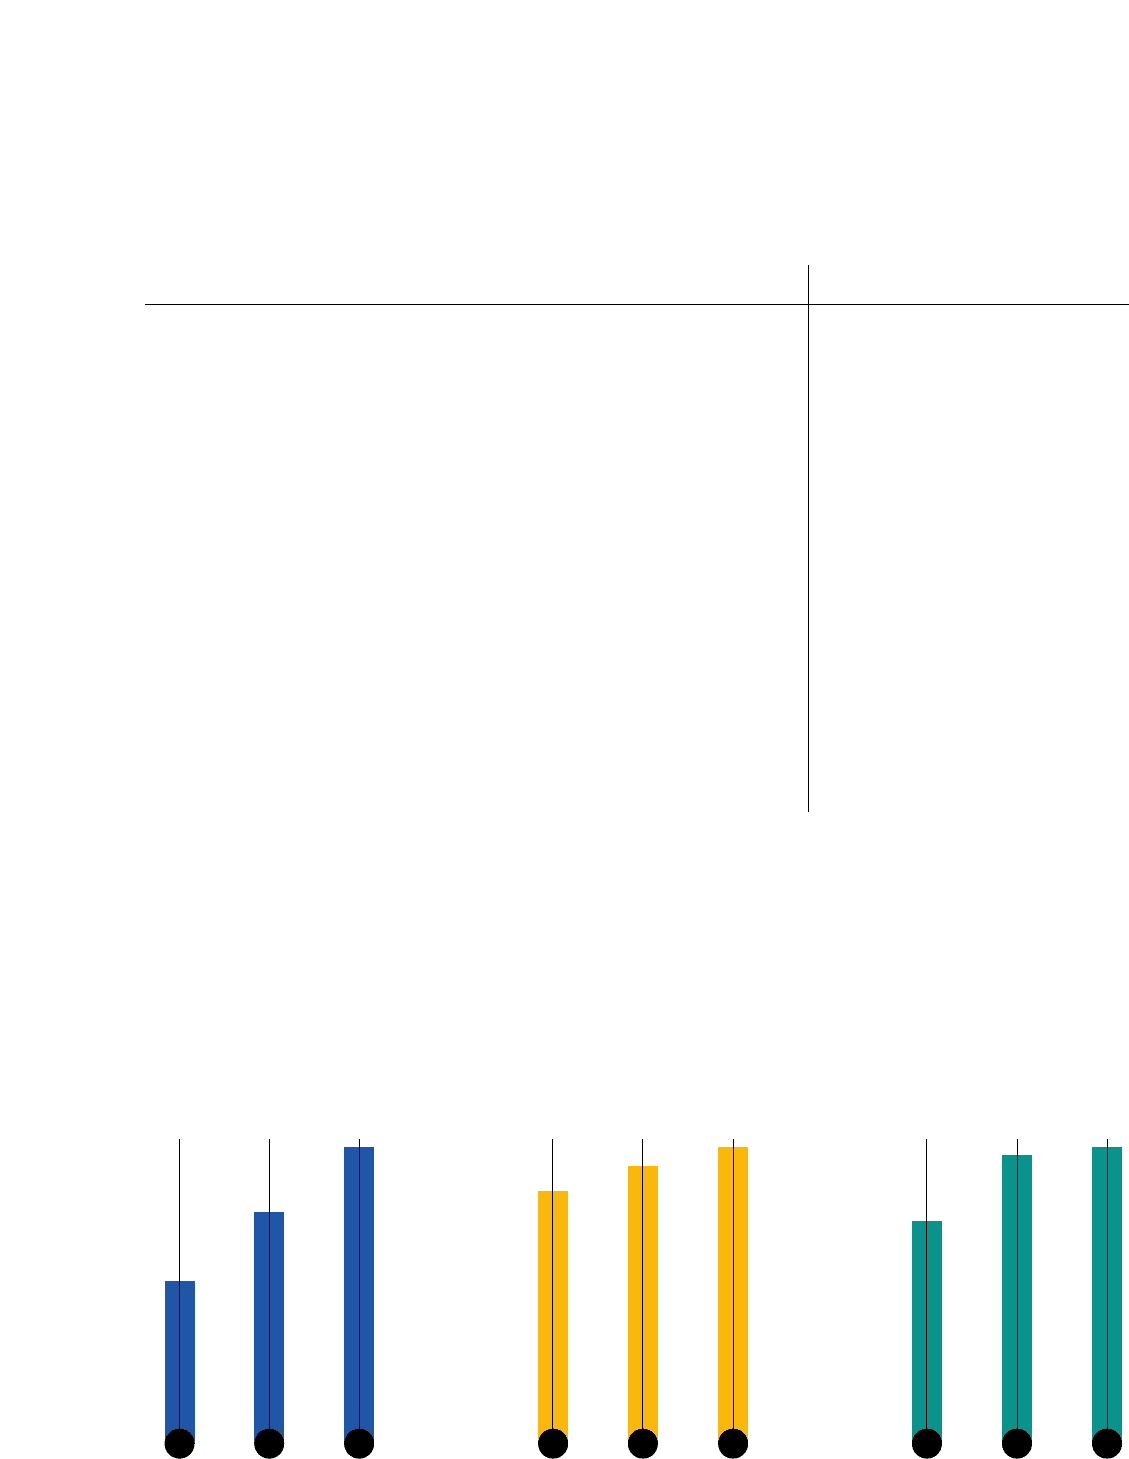
95 96 97 95 96 9795 96 97
$0.68 $0.97 $1.25 6.52% 7.70% 5.35x 6.94x 7.18x
7.18%
Diluted Earnings per Share
(BEFORE EXTRAORDINARY LOSS)
Operating Cash Flow*
(% OF SALES)
Interest Coverage Ratio*
*Defined on page 17
53 Weeks 52 Weeks 52 Weeks
(Dollars in millions, except per-share amounts) 1997 1996 1995
■■■■■
For the Year:
Sales $22,483.8 $17,269.0 $16,397.5
Gross profit 6,414.7 4,774.2 4,492.4
Operating profit 1,279.7 891.7 727.4
Income before extraordinary loss 621.5 460.6 328.3
Net income 557.4 460.6 326.3
Diluted earnings per share (Note 1):
Income before extraordinary loss $ 1.25 $ 0.97 $ 0.68
Net income 1.12 0.97 0.68
Capital expenditures (Note 2) 829.4 620.3 503.2
At Year-End:
Common shares outstanding (in millions) (Notes 1 and 3) 476.2 442.8 427.4
Retail square feet (in millions) 53.2 40.7 40.1
Number of stores 1,368 1,052 1,059
Note 1: Share and per-share amounts reflect the two-for-one stock splits effected in February 1998 and in January 1996.
Earnings per share have been restated in accordance with Statement of Financial Accounting Standard No.128.
Note 2: Defined on pages 13 and 14 under “Capital Expenditure Program.”
Note 3: 1997 net of 61.2 million shares held in treasury.
Financial Highlights