Safeway 1997 Annual Report Download - page 35
Download and view the complete annual report
Please find page 35 of the 1997 Safeway annual report below. You can navigate through the pages in the report by either clicking on the pages listed below, or by using the keyword search tool below to find specific information within the annual report.-
 1
1 -
2
-
3
-
4
-
5
-
6
-
7
-
8
-
9
-
10
-
11
-
12
-
13
-
14
-
15
-
16
-
17
-
18
-
19
-
20
-
21
-
22
-
23
-
24
-
 25
25 -
 26
26 -
 27
27 -
 28
28 -
 29
29 -
 30
30 -
 31
31 -
 32
32 -
 33
33 -
 34
34 -
 35
35 -
 36
36 -
 37
37 -
 38
38 -
 39
39 -
 40
40 -
 41
41 -
 42
42 -
 43
43 -
 44
44
 |
 |

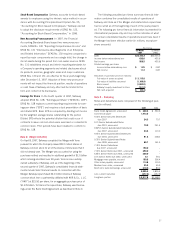
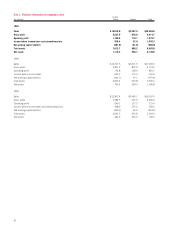
The reconciliation of the provision for income taxes at the
U.S. federal statutory income tax rate to the Company’s income
taxes is as follows (dollars in millions):
1997 1996 1995
Statutory rate 35% 35% 35%
Income tax expense using
federal statutory rate $376.7 $268.7 $194.8
State taxes on income net
of federal benefit 42.8 28.1 18.9
Taxes provided on equity in
earnings of unconsolidated
affiliates at rates below the
statutory rate (9.4) (10.5) (5.3)
Taxes on foreign earnings
not permanently reinvested 8.9 7.3 6.2
Withholding tax on Canadian
earnings not permanently
reinvested –– (5.8)
Nondeductible expenses and
amortization 13.6 3.2 4.2
Difference between statutory rate
and foreign effective rate 10.6 11.1 1.0
Other accruals 11.6 (0.9) 14.2
■■■■■■■■
$454.8 $307.0 $228.2
■■■■■■■■
Significant components of the Company’s net deferred tax
liability at year-end were as follows (in millions):
1997 1996 1995
Deferred tax assets:
Workers’ compensation
and other claims $ 138.8 $ 91.7 $ 102.9
Accruals not currently deductible 80.3 48.7 59.5
Accrued claims and other liabilities 48.8 47.4 48.3
Employee benefits 18.4 9.7 34.0
Canadian operating loss
carryforward –2.7 54.7
Other assets 14.6 6.0 14.5
■■■■■■■■
300.9 206.2 313.9
■■■■■■■■
Deferred tax liabilities:
Property (280.8) (110.5) (124.3)
Prepaid pension costs (161.3) (149.9) (142.7)
LIFO inventory reserves (106.0) (66.8) (53.7)
Investments in unconsolidated
affiliates (15.3) (48.1) (40.0)
Cumulative translation
adjustments (16.2) (23.0) (24.6)
Other liabilities (18.3) (31.7) (37.1)
■■■■■■■■
(597.9) (430.0) (422.4)
■■■■■■■■
Net deferred tax liability $(297.0) $(223.8) $(108.5)
■■■■■■■■
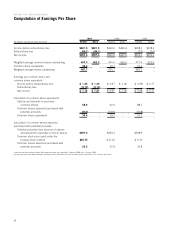
Note H: Employee Benefit Plans and Collective
Bargaining Aggreements
Retirement Plans The Company maintains defined benefit, non-
contributory pension plans (the “Plans”) for substantially all of
its U.S. and Canadian employees not participating in multi-
employer pension plans. Benefits are generally based upon
years of service, age at retirement date and employee’s com-
pensation during the last years of employment. The Company’s
funding policy is to contribute annually the amount necessary
to satisfy the statutory funding standards. Through year-end
1997, the assets of Safeway’s U.S. Plans have been considered
fully funded for purposes of contribution requirements.
Accordingly, no Company contributions were made to the U.S.
Plans during the last three years. In 1997, 1996 and 1995, the
Company contributed $10.0 million, $10.6 million and $10.3
million to the Canadian Plan. Assets of the Plans are primarily
composed of marketable equity and interest-bearing securities.
The Company has assumed the obligations of Vons’ benefit
plan. The actuarial assumptions for the existing Vons benefit
plans are comparable to the existing plans of the Company.
The Vons’ retirement plan has been combined with Safeway’s
for financial statement presentation.
Actuarial assumptions used to determine year-end Plan
status were as follows:
1997 1996 1995
Discount rate used to
determine the projected
benefit obligation:
U.S. Plans 7.0% 7.5% 7.0%
Canadian Plan 6.3 7.0 8.0
Combined weighted
average rate 6.8 7.4 7.2
Long-term rate of return on
Plan assets:
U. S. Plans 9.0 9.0 9.0
Canadian Plan 8.0 8.0 8.0
Rate of compensation
increase:
U. S. Plans 5.0 5.5 5.5
Canadian Plan 4.5 5.5 5.5
Net pension plan income (expense) consisted of the follow-
ing (in millions):
1997 1996 1995
Return on plan assets:
Actual return, gain $ 263.8 $162.4 $ 241.2
Deferred (gain) (145.5) (14.2) (152.9)
■■■■■■■■
Actuarial assumed return 118.3 148.2 88.3
Service cost (42.5) (41.3) (36.7)
Interest cost on projected
benefit obligations (60.1) (51.7) (48.3)
Net amortization (11.6) (56.0) (10.9)
■■■■■■■■
Net pension plan income
(expense) recognized in
consolidated statements
of income $ 4.1 $ (0.8) $ (7.6)
■■■■■■■■
32