Safeway 1997 Annual Report Download - page 39
Download and view the complete annual report
Please find page 39 of the 1997 Safeway annual report below. You can navigate through the pages in the report by either clicking on the pages listed below, or by using the keyword search tool below to find specific information within the annual report.-
 1
1 -
2
-
3
-
4
-
5
-
6
-
7
-
8
-
9
-
10
-
11
-
12
-
13
-
14
-
15
-
16
-
17
-
18
-
19
-
20
-
21
-
22
-
23
-
24
-
25
-
26
-
27
-
28
-
 29
29 -
 30
30 -
 31
31 -
 32
32 -
 33
33 -
 34
34 -
 35
35 -
 36
36 -
 37
37 -
 38
38 -
 39
39 -
 40
40 -
 41
41 -
 42
42 -
 43
43 -
 44
44
 |
 |

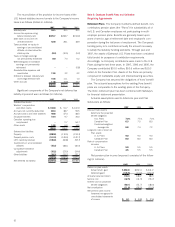
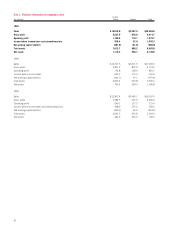
Note L: Financial Information by Geographic Area
United
(In millions) States Canada Total
1997
Sales $19,075.9 $3,407.9 $22,483.8
Gross profit 5,537.9 876.8 6,414.7
Operating profit 1,169.6 110.1 1,279.7
Income before income taxes and extraordinary loss 978.4 97.9 1,076.3
Net working capital (deficit) (487.9) (21.0) (508.9)
Total assets 7,613.7 880.2 8,493.9
Net assets 1,712.3 436.7 2,149.0
1996
Sales $13,797.5 $3,471.5 $17,269.0
Gross profit 3,901.3 872.9 4,774.2
Operating profit 752.8 138.9 891.7
Income before income taxes 652.2 115.4 767.6
Net working capital (deficit) (442.7) 67.1 (375.6)
Total assets 4,625.4 919.8 5,545.2
Net assets 792.4 394.4 1,186.8
1995
Sales $12,902.4 $3,495.1 $16,397.5
Gross profit 3,584.5 907.9 4,492.4
Operating profit 590.1 137.3 727.4
Income before income taxes and extraordinary loss 448.9 107.6 556.5
Net working capital (deficit) (490.1) 65.9 (424.2)
Total assets 4,261.5 932.8 5,194.3
Net assets 462.6 332.9 795.5
36