Starbucks 2005 Annual Report Download - page 56
Download and view the complete annual report
Please find page 56 of the 2005 Starbucks annual report below. You can navigate through the pages in the report by either clicking on the pages listed below, or by using the keyword search tool below to find specific information within the annual report.-
 1
1 -
2
-
3
-
4
-
5
-
6
-
7
-
8
-
9
-
10
-
11
-
12
-
13
-
14
-
15
-
16
-
17
-
18
-
19
-
20
-
21
-
22
-
23
-
24
-
25
-
26
-
27
-
28
-
29
-
30
-
31
-
32
-
33
-
34
-
35
-
36
-
37
-
38
-
39
-
40
-
41
-
42
-
43
-
44
-
45
-
 46
46 -
 47
47 -
 48
48 -
 49
49 -
 50
50 -
 51
51 -
 52
52 -
 53
53 -
 54
54 -
 55
55 -
 56
56 -
 57
57 -
 58
58 -
 59
59 -
 60
60 -
 61
61 -
 62
62 -
 63
63 -
 64
64 -
 65
65 -
 66
66 -
67
-
68
-
69
-
70
-
71
-
72
-
73
-
74
-
75
-
76
-
77
-
78
-
79
-
80
-
81
-
82
-
83
-
84
-
85
-
86
-
87
-
88
-
89
-
90
-
91
-
92
-
93
-
94
-
95
-
96
 |
 |

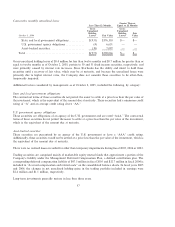
As shown in the tables below, the cumulative effect of the accounting change for financial results previously
reported under the cost method and as restated in this Report under the equity method resulted in reductions
of net earnings of $0.1 million for the 39 weeks ended July 3, 2005, and $0.3 million and $0.1 million for the
fiscal years ended October 3, 2004, and September 28, 2003, respectively (in thousands, except earnings per
share):
Jan 2, April 3, July 3, July 3,
2005 2005 2005 2005
Fiscal Period Ended (13 Weeks) (13 Weeks) (13 Weeks) (39 Weeks)
Net earnings, as previously reported ÏÏÏÏÏÏÏÏ $144,753 $100,536 $125,575 $370,864
Effect of change to equity method ÏÏÏÏÏÏÏÏÏ (43) (54) (47) (144)
Net earnings, as restated for Southern China
and Chile acquisitionsÏÏÏÏÏÏÏÏÏÏÏÏÏÏÏÏÏÏ $144,710 $100,482 $125,528 $370,720
Net earnings per common share Ì basic:
As previously reported ÏÏÏÏÏÏÏÏÏÏÏÏÏÏÏÏÏ $ 0.18 $ 0.13 $ 0.16 $ 0.47
As restated for Southern China and Chile
acquisitionsÏÏÏÏÏÏÏÏÏÏÏÏÏÏÏÏÏÏÏÏÏÏÏÏÏ $ 0.18 $ 0.13 $ 0.16 $ 0.47
Net earnings per common share Ì diluted:
As previously reported ÏÏÏÏÏÏÏÏÏÏÏÏÏÏÏÏÏ $ 0.17 $ 0.12 $ 0.16 $ 0.45
As restated for Southern China and Chile
acquisitionsÏÏÏÏÏÏÏÏÏÏÏÏÏÏÏÏÏÏÏÏÏÏÏÏÏ $ 0.17 $ 0.12 $ 0.16 $ 0.45
The following table summarizes the effects of the investment accounting change on net earnings and earnings
per share for the periods indicated (in thousands, except earnings per share):
Oct 3, 2004 Sept 28, 2003
Fiscal Year Ended (53 Weeks) (52 Weeks)
Net earnings, as previously reportedÏÏÏÏÏÏÏÏÏÏÏÏÏÏÏÏÏÏÏÏÏÏÏÏÏÏÏÏÏÏ $389,272 $265,493
Effect of change to equity method ÏÏÏÏÏÏÏÏÏÏÏÏÏÏÏÏÏÏÏÏÏÏÏÏÏÏÏÏÏÏÏ (299) (138)
Net earnings, as restated for Southern China and Chile acquisitions ÏÏ $388,973 $265,355
Net earnings per common share Ì basic:
As previously reported ÏÏÏÏÏÏÏÏÏÏÏÏÏÏÏÏÏÏÏÏÏÏÏÏÏÏÏÏÏÏÏÏÏÏÏÏÏÏÏ $ 0.49 $ 0.34
As restated for Southern China and Chile acquisitions ÏÏÏÏÏÏÏÏÏÏÏÏ $ 0.49 $ 0.34
Net earnings per common share Ì diluted:
As previously reported ÏÏÏÏÏÏÏÏÏÏÏÏÏÏÏÏÏÏÏÏÏÏÏÏÏÏÏÏÏÏÏÏÏÏÏÏÏÏÏ $ 0.47 $ 0.33
As restated for Southern China and Chile acquisitions ÏÏÏÏÏÏÏÏÏÏÏÏ $ 0.47 $ 0.33
54