Starbucks 2005 Annual Report Download - page 58
Download and view the complete annual report
Please find page 58 of the 2005 Starbucks annual report below. You can navigate through the pages in the report by either clicking on the pages listed below, or by using the keyword search tool below to find specific information within the annual report.-
 1
1 -
2
-
3
-
4
-
5
-
6
-
7
-
8
-
9
-
10
-
11
-
12
-
13
-
14
-
15
-
16
-
17
-
18
-
19
-
20
-
21
-
22
-
23
-
24
-
25
-
26
-
27
-
28
-
29
-
30
-
31
-
32
-
33
-
34
-
35
-
36
-
37
-
38
-
39
-
40
-
41
-
42
-
43
-
44
-
45
-
46
-
47
-
 48
48 -
 49
49 -
 50
50 -
 51
51 -
 52
52 -
 53
53 -
 54
54 -
 55
55 -
 56
56 -
 57
57 -
 58
58 -
 59
59 -
 60
60 -
 61
61 -
 62
62 -
 63
63 -
 64
64 -
 65
65 -
 66
66 -
 67
67 -
 68
68 -
69
-
70
-
71
-
72
-
73
-
74
-
75
-
76
-
77
-
78
-
79
-
80
-
81
-
82
-
83
-
84
-
85
-
86
-
87
-
88
-
89
-
90
-
91
-
92
-
93
-
94
-
95
-
96
 |
 |

Gross Gross
Unrealized Unrealized
Amortized Holding Holding
October 3, 2004 Cost Gains Losses Fair Value
Short-term investments Ì
available-for-sale securities:
State and local government obligations ÏÏÏÏÏÏÏ $436,754 $20 $(583) $436,191
U.S. government agency obligations ÏÏÏÏÏÏÏÏÏ 6,655 Ì (4) 6,651
Corporate debt securitiesÏÏÏÏÏÏÏÏÏÏÏÏÏÏÏÏÏÏÏ 27,275 Ì Ì 27,275
Asset-backed securities ÏÏÏÏÏÏÏÏÏÏÏÏÏÏÏÏÏÏÏÏ 13,020 50 (30) 13,040
Total ÏÏÏÏÏÏÏÏÏÏÏÏÏÏÏÏÏÏÏÏÏÏÏÏÏÏÏÏÏÏÏÏÏ $483,704 $70 $(617) $483,157
Short-term investments Ì trading securitiesÏÏÏÏÏ 24,769 24,799
Total short-term investments ÏÏÏÏÏÏÏÏÏÏÏÏÏÏÏÏÏ $508,473 $507,956
Long-term investments Ì
available-for-sale securities:
State and local government obligations ÏÏÏÏÏÏÏ $130,810 $67 $(348) $130,529
Corporate debt securitiesÏÏÏÏÏÏÏÏÏÏÏÏÏÏÏÏÏÏÏ 4,000 Ì Ì 4,000
Asset-backed securities ÏÏÏÏÏÏÏÏÏÏÏÏÏÏÏÏÏÏÏÏ 658 Ì (8) 650
Total long-term investments ÏÏÏÏÏÏÏÏÏÏÏÏÏÏÏÏÏÏ $135,468 $67 $(356) $135,179
For available-for-sale securities, proceeds from sales were $626 million, $452 million and $141 million, in
fiscal years 2005, 2004 and 2003, respectively. Gross realized gains from sales were $0.1 million, $0.2 million
and $0.3 million in fiscal years 2005, 2004 and 2003, respectively, and gross realized losses from sales were
$1.7 million in 2005 and $0.4 million in 2004. There were no gross realized losses in 2003.
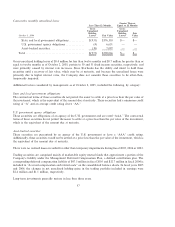
The following tables present the length of time available-for-sale securities were in continuous unrealized loss
positions but were not deemed to be other-than-temporarily impaired (in thousands):
Consecutive monthly unrealized losses
Greater Than or Equal
Less Than 12 Months to 12 Months
Gross Gross
Unrealized Unrealized
Holding Fair Holding Fair
October 2, 2005 Losses Value Losses Value
State and local government obligations ÏÏÏÏÏÏÏÏÏ $(371) $49,527 $(576) $43,699
U.S. government agency obligations ÏÏÏÏÏÏÏÏÏÏÏ (21) 11,306 Ì Ì
Asset-backed securities ÏÏÏÏÏÏÏÏÏÏÏÏÏÏÏÏÏÏÏÏÏÏ (34) 3,467 (82) 3,790
Total ÏÏÏÏÏÏÏÏÏÏÏÏÏÏÏÏÏÏÏÏÏÏÏÏÏÏÏÏÏÏÏÏÏÏÏÏÏÏÏ $(426) $64,300 $(658) $47,489
56