Walgreens 2014 Annual Report Download - page 44
Download and view the complete annual report
Please find page 44 of the 2014 Walgreens annual report below. You can navigate through the pages in the report by either clicking on the pages listed below, or by using the keyword search tool below to find specific information within the annual report.-
 1
1 -
2
-
3
-
4
-
5
-
6
-
7
-
8
-
9
-
10
-
11
-
12
-
13
-
14
-
15
-
16
-
17
-
18
-
19
-
20
-
21
-
22
-
23
-
24
-
25
-
26
-
27
-
28
-
29
-
30
-
31
-
32
-
33
-
 34
34 -
 35
35 -
 36
36 -
 37
37 -
 38
38 -
 39
39 -
 40
40 -
 41
41 -
 42
42 -
 43
43 -
 44
44 -
 45
45 -
 46
46 -
 47
47 -
 48
48 -
 49
49 -
 50
50 -
 51
51 -
 52
52 -
 53
53 -
 54
54 -
55
-
56
-
57
-
58
-
59
-
60
-
61
-
62
-
63
-
64
-
65
-
66
-
67
-
68
-
69
-
70
-
71
-
72
-
73
-
74
-
75
-
76
-
77
-
78
-
79
-
80
-
81
-
82
-
83
-
84
-
85
-
86
-
87
-
88
-
89
-
90
-
91
-
92
-
93
-
94
-
95
-
96
-
97
-
98
-
99
-
100
-
101
-
102
-
103
-
104
-
105
-
106
-
107
-
108
-
109
-
110
-
111
-
112
-
113
-
114
-
115
-
116
-
117
-
118
-
119
-
120
 |
 |

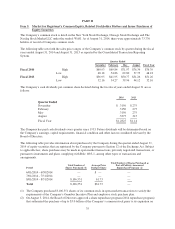
August 31, 2016. On July 13, 2011, the Board of Directors approved a share repurchase program (2012
repurchase program) that authorized the repurchase of up to $2.0 billion of the Company’s common stock
prior to its expiration on December 31, 2015. The 2012 repurchase program, which had remaining
authorized purchases of $425 million, was replaced in its entirety by the 2014 repurchase program. The total
remaining authorization under the 2014 repurchase program was $3.0 billion as of August 31, 2014.
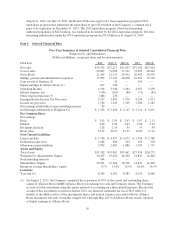
Item 6. Selected Financial Data
Five-Year Summary of Selected Consolidated Financial Data
Walgreen Co. and Subsidiaries
(Dollars in Millions, except per share and location amounts)
Fiscal Year 2014 2013 (1) 2012 (1) 2011 2010 (4)
Net sales $76,392 $72,217 $71,633 $72,184 $67,420
Cost of sales 54,823 51,098 51,291 51,692 48,444
Gross Profit 21,569 21,119 20,342 20,492 18,976
Selling, general and administrative expenses 17,992 17,543 16,878 16,561 15,518
Gain on sale of business (2) — 20 — 434 —
Equity earnings in Alliance Boots (1) 617 344 — — —
Operating Income 4,194 3,940 3,464 4,365 3,458
Interest expense, net (156) (165) (88) (71) (85)
Other (expense)/income (3) (481) 120 — — —
Earnings Before Income Tax Provision 3,557 3,895 3,376 4,294 3,373
Income tax provision 1,526 1,445 1,249 1,580 1,282
Net earnings attributable to noncontrolling interests 99 ————
Net Earnings attributable to Walgreen Co. $ 1,932 $ 2,450 $ 2,127 $ 2,714 $ 2,091
Per Common Share
Net earnings
Basic $ 2.03 $ 2.59 $ 2.43 $ 2.97 $ 2.13
Diluted 2.00 2.56 2.42 2.94 2.12
Dividends declared 1.28 1.14 .95 .75 .59
Book value 21.52 20.55 19.32 16.69 15.34
Non-Current Liabilities
Long-term debt $ 3,736 $ 4,477 $ 4,073 $ 2,396 $ 2,389
Deferred income taxes 1,048 600 545 343 318
Other non-current liabilities 2,942 2,067 1,886 1,785 1,735
Assets and Equity
Total Assets $37,182 $35,481 $33,462 $27,454 $26,275
Walgreen Co. Shareholders’ Equity 20,457 19,454 18,236 14,847 14,400
Noncontrolling interests 104 ————
Shareholders’ Equity 20,561 19,454 18,236 14,847 14,400
Return on average shareholders’ equity 9.7% 13.0% 12.9% 18.6% 14.5%
Locations
Year-end (5) 8,309 8,582 8,385 8,210 8,046
(1) On August 2, 2012, the Company completed the acquisition of 45% of the issued and outstanding share
capital of Alliance Boots GmbH (Alliance Boots) in exchange for cash and Company shares. The Company
accounts for this investment using the equity method of accounting on a three-month lag basis. Because the
closing of this investment occurred in August 2012, our financial statements for fiscal 2013 reflect 12
months of the dilutive effect of the incremental shares and interest expense associated with our Alliance
Boots investment, but only 10 months (August 2012 through May 2013) of Alliance Boots results, reported
as Equity earnings in Alliance Boots.
36