Walgreens 2014 Annual Report Download - page 97
Download and view the complete annual report
Please find page 97 of the 2014 Walgreens annual report below. You can navigate through the pages in the report by either clicking on the pages listed below, or by using the keyword search tool below to find specific information within the annual report.-
 1
1 -
2
-
3
-
4
-
5
-
6
-
7
-
8
-
9
-
10
-
11
-
12
-
13
-
14
-
15
-
16
-
17
-
18
-
19
-
20
-
21
-
22
-
23
-
24
-
25
-
26
-
27
-
28
-
29
-
30
-
31
-
32
-
33
-
34
-
35
-
36
-
37
-
38
-
39
-
40
-
41
-
42
-
43
-
44
-
45
-
46
-
47
-
48
-
49
-
50
-
51
-
52
-
53
-
54
-
55
-
56
-
57
-
58
-
59
-
60
-
61
-
62
-
63
-
64
-
65
-
66
-
67
-
68
-
69
-
70
-
71
-
72
-
73
-
74
-
75
-
76
-
77
-
78
-
79
-
80
-
81
-
82
-
83
-
84
-
85
-
86
-
 87
87 -
 88
88 -
 89
89 -
 90
90 -
 91
91 -
 92
92 -
 93
93 -
 94
94 -
 95
95 -
 96
96 -
 97
97 -
 98
98 -
 99
99 -
 100
100 -
 101
101 -
 102
102 -
 103
103 -
 104
104 -
 105
105 -
 106
106 -
 107
107 -
108
-
109
-
110
-
111
-
112
-
113
-
114
-
115
-
116
-
117
-
118
-
119
-
120
 |
 |

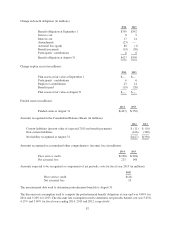
Included in the Consolidated Balance Sheets captions are the following assets and liabilities (in millions):
2014 2013
Accounts receivable –
Accounts receivable $3,391 $2,786
Allowance for doubtful accounts (see Note 1) (173) (154)
$3,218 $2,632
Other non-current assets –
Intangible assets, net (see Note 7) $1,180 $1,307
Investment in AmerisourceBergen 887 225
Warrants 553 188
Other 456 239
$3,076 $1,959
Accrued expenses and other liabilities –
Accrued salaries $1,123 $ 928
Taxes other than income taxes 377 420
Insurance 185 285
Profit sharing 259 239
Other 1,757 1,705
$3,701 $3,577
Other non-current liabilities –
Postretirement healthcare benefits $ 416 $ 340
Accrued rent 409 382
Insurance 428 403
Other 1,689 942
$2,942 $2,067
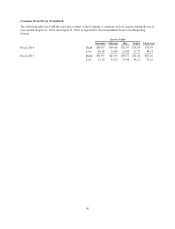
Summary of Quarterly Results (Unaudited)
(In millions, except per share amounts)
Quarter Ended
November February May August Fiscal Year
Fiscal 2014
Net Sales $18,329 $19,605 $19,401 $19,057 $76,392
Gross Profit 5,152 5,650 5,440 5,327 21,569
Net Earnings attributable to Walgreen Co. 695 754 722 (239) 1,932
Per Common Share –
Basic $ 0.73 $ 0.79 $ 0.76 $ (0.25) $ 2.03
Diluted 0.72 0.78 0.75 (0.25) 2.00
Cash Dividends Declared Per Common Share $ 0.315 $ 0.315 $ 0.315 $0.3375 $1.2825
Fiscal 2013
Net Sales $17,316 $18,647 $18,313 $17,941 $72,217
Gross Profit 5,099 5,607 5,222 5,191 21,119
Net Earnings 413 756 624 657 2,450
Per Common Share –
Basic $ 0.44 $ 0.80 $ 0.66 $ 0.69 $ 2.59
Diluted 0.43 0.79 0.65 0.69 2.56
Cash Dividends Declared Per Common Share $ 0.275 $ 0.275 $ 0.275 $ 0.315 $ 1.140
89