Walgreens 2014 Annual Report Download - page 94
Download and view the complete annual report
Please find page 94 of the 2014 Walgreens annual report below. You can navigate through the pages in the report by either clicking on the pages listed below, or by using the keyword search tool below to find specific information within the annual report.-
 1
1 -
2
-
3
-
4
-
5
-
6
-
7
-
8
-
9
-
10
-
11
-
12
-
13
-
14
-
15
-
16
-
17
-
18
-
19
-
20
-
21
-
22
-
23
-
24
-
25
-
26
-
27
-
28
-
29
-
30
-
31
-
32
-
33
-
34
-
35
-
36
-
37
-
38
-
39
-
40
-
41
-
42
-
43
-
44
-
45
-
46
-
47
-
48
-
49
-
50
-
51
-
52
-
53
-
54
-
55
-
56
-
57
-
58
-
59
-
60
-
61
-
62
-
63
-
64
-
65
-
66
-
67
-
68
-
69
-
70
-
71
-
72
-
73
-
74
-
75
-
76
-
77
-
78
-
79
-
80
-
81
-
82
-
83
-
 84
84 -
 85
85 -
 86
86 -
 87
87 -
 88
88 -
 89
89 -
 90
90 -
 91
91 -
 92
92 -
 93
93 -
 94
94 -
 95
95 -
 96
96 -
 97
97 -
 98
98 -
 99
99 -
 100
100 -
 101
101 -
 102
102 -
 103
103 -
 104
104 -
105
-
106
-
107
-
108
-
109
-
110
-
111
-
112
-
113
-
114
-
115
-
116
-
117
-
118
-
119
-
120
 |
 |

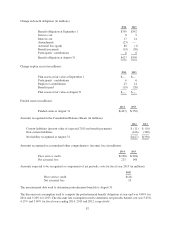
A summary of information relative to the Company’s performance shares follows:
Shares
Weighted-Average
Grant-Date Fair
Value
Outstanding Shares
Outstanding at August 31, 2013 2,217,610 $32.99
Granted 615,921 65.08
Forfeited (163,473) 44.01
Vested (606,926) 28.31
Outstanding at August 31, 2014 2,063,132 $44.85
The Company also issues shares to nonemployee directors. Each director receives an equity grant of shares every
year on November 1. The number of shares granted is determined by dividing $175,000 by the price of a share of
common stock on November 1. Each nonemployee director may elect to receive this annual share grant in the
form of shares or deferred stock units. In fiscal 2014, nonemployee directors received a share grant of 2,892
shares compared to 4,789 shares and 4,788 shares in fiscal 2013 and 2012, respectively. New directors in any
fiscal year earned a prorated amount. Payment of the annual retainer is paid in the form of cash, which may be
deferred.
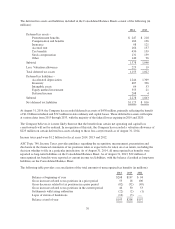
A summary of total stock-based compensation expense follows (in millions):
2014 2013 2012
Stock options $ 52 $ 51 $62
Restricted stock units 48 33 24
Performance shares 8 15 7
Share Walgreens 6 5 6
$114 $104 $99
(15) Retirement Benefits
The principal retirement plan for employees is the Walgreen Profit-Sharing Retirement Trust, to which both the
Company and participating employees contribute. The Company’s contribution, which has historically related to
FIFO earnings before interest and taxes and a portion of which is in the form of a guaranteed match, is
determined annually at the discretion of the Board of Directors. The profit-sharing provision was $355 million in
fiscal 2014, $342 million in fiscal 2013 and $283 million in fiscal 2012. The Company’s contributions were $328
million in fiscal 2014, $262 million in fiscal 2013 and $372 million in fiscal 2012.
The Company provides certain health insurance benefits for retired employees who meet eligibility requirements,
including age, years of service and date of hire. The costs of these benefits are accrued over the service life of the
employee. In fiscal 2012, the Company amended its prescription drug program for certain Medicare-eligible
retirees to a group-based Company-sponsored Medicare Part D program, or employer group waiver program,
effective January 1, 2013. The Company’s postretirement health benefit plan is not funded.
Components of net periodic benefit costs (in millions):
2014 2013 2012
Service cost $ 8 $ 9 $ 13
Interest cost 17 14 22
Amortization of actuarial loss 11 12 8
Amortization of prior service cost (23) (22) (10)
Total postretirement benefit cost $ 13 $ 13 $ 33
86