Walgreens 2014 Annual Report Download - page 80
Download and view the complete annual report
Please find page 80 of the 2014 Walgreens annual report below. You can navigate through the pages in the report by either clicking on the pages listed below, or by using the keyword search tool below to find specific information within the annual report.-
 1
1 -
2
-
3
-
4
-
5
-
6
-
7
-
8
-
9
-
10
-
11
-
12
-
13
-
14
-
15
-
16
-
17
-
18
-
19
-
20
-
21
-
22
-
23
-
24
-
25
-
26
-
27
-
28
-
29
-
30
-
31
-
32
-
33
-
34
-
35
-
36
-
37
-
38
-
39
-
40
-
41
-
42
-
43
-
44
-
45
-
46
-
47
-
48
-
49
-
50
-
51
-
52
-
53
-
54
-
55
-
56
-
57
-
58
-
59
-
60
-
61
-
62
-
63
-
64
-
65
-
66
-
67
-
68
-
69
-
 70
70 -
 71
71 -
 72
72 -
 73
73 -
 74
74 -
 75
75 -
 76
76 -
 77
77 -
 78
78 -
 79
79 -
 80
80 -
 81
81 -
 82
82 -
 83
83 -
 84
84 -
 85
85 -
 86
86 -
 87
87 -
 88
88 -
 89
89 -
 90
90 -
91
-
92
-
93
-
94
-
95
-
96
-
97
-
98
-
99
-
100
-
101
-
102
-
103
-
104
-
105
-
106
-
107
-
108
-
109
-
110
-
111
-
112
-
113
-
114
-
115
-
116
-
117
-
118
-
119
-
120
 |
 |

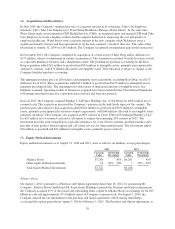
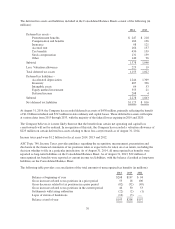
Summarized Financial Information
Summarized financial information for the Company’s equity method investees is as follows:
Balance Sheet (in millions)
At August 31,
2014 (1) 2013 (1)
Current Assets $ 8,768 $ 8,906
Non-Current Assets 21,525 19,484
Current Liabilities 7,791 7,204
Non-Current Liabilities 11,285 12,228
Shareholders’ Equity (2) 11,217 8,958
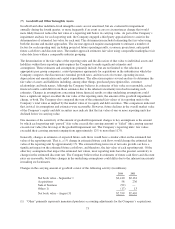
Income Statement (in millions)
Year Ended August 31,
2014 (3) 2013 2012
Net sales $37,305 $30,446 $37
Gross Profit 7,927 6,391 17
Net Earnings 1,446 1,022 2
Share of income from investments accounted for using the
equity method (3) 618 345 1
(1) Net assets in Alliance Boots are translated at the May 31, 2014 spot rate of $1.68 to one British pound
Sterling, corresponding to the three-month lag. Fiscal 2013 net assets in Alliance Boots were translated at a
spot rate of $1.52 to one British pound Sterling.
(2) Shareholders’ equity at August 31, 2014 and 2013, includes $257 million and $374 million related to non-
controlling interests, respectively.
(3) The Company utilizes a three-month lag in reporting its share of equity income in Alliance Boots. The fiscal
year ended August 31, 2013 included only ten month’s results for Alliance Boots because of the three-
month lag and the timing of the investment on August 2, 2012, compared to twelve months results recorded
in fiscal 2014. Earnings in Alliance Boots are translated at the average exchange rate of $1.61 and $1.57 to
one British pound Sterling for the years ended August 31, 2014 and 2013 respectively. Walgreens Boots
Alliance Development GmbH operations are excluded from these results as the Company consolidates the
joint venture.
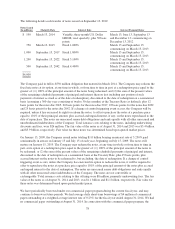
(6) Available-for-Sale Investments
In conjunction with its long-term relationship with AmerisourceBergen, the Company has the right to acquire up
to 7% of the common shares of AmerisourceBergen through open market transactions. The Company’s cost basis
of common shares acquired in fiscal 2014 and 2013 were $493 million and $224 million, respectively. The
available-for-sale investment is classified as long-term and reported at fair value within other non-current assets
in the Consolidated Balance Sheets. The Company also holds other investments with maturities greater than 90
days that are reported at fair value within other current assets in the Consolidated Balance Sheets.
Fair value adjustments are based on quoted stock prices with the unrealized holding gains and losses reported in
other comprehensive income. Unrealized holding gains at August 31, 2014 and 2013 were $170 million and $1
million, respectively. See Note 11 for additional fair value disclosures. Available-for-sale investments reported at
fair value at August 31, 2014 and 2013 were $887 million and $225 million, respectively.
72