Walgreens 2014 Annual Report Download - page 95
Download and view the complete annual report
Please find page 95 of the 2014 Walgreens annual report below. You can navigate through the pages in the report by either clicking on the pages listed below, or by using the keyword search tool below to find specific information within the annual report.-
 1
1 -
2
-
3
-
4
-
5
-
6
-
7
-
8
-
9
-
10
-
11
-
12
-
13
-
14
-
15
-
16
-
17
-
18
-
19
-
20
-
21
-
22
-
23
-
24
-
25
-
26
-
27
-
28
-
29
-
30
-
31
-
32
-
33
-
34
-
35
-
36
-
37
-
38
-
39
-
40
-
41
-
42
-
43
-
44
-
45
-
46
-
47
-
48
-
49
-
50
-
51
-
52
-
53
-
54
-
55
-
56
-
57
-
58
-
59
-
60
-
61
-
62
-
63
-
64
-
65
-
66
-
67
-
68
-
69
-
70
-
71
-
72
-
73
-
74
-
75
-
76
-
77
-
78
-
79
-
80
-
81
-
82
-
83
-
84
-
 85
85 -
 86
86 -
 87
87 -
 88
88 -
 89
89 -
 90
90 -
 91
91 -
 92
92 -
 93
93 -
 94
94 -
 95
95 -
 96
96 -
 97
97 -
 98
98 -
 99
99 -
 100
100 -
 101
101 -
 102
102 -
 103
103 -
 104
104 -
 105
105 -
106
-
107
-
108
-
109
-
110
-
111
-
112
-
113
-
114
-
115
-
116
-
117
-
118
-
119
-
120
 |
 |

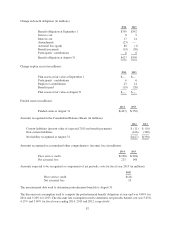
Change in benefit obligation (in millions):
2014 2013
Benefit obligation at September 1 $350 $342
Service cost 8 9
Interest cost 17 14
Amendments (23) —
Actuarial loss (gain) 88 (1)
Benefit payments (19) (20)
Participants’ contributions 6 6
Benefit obligation at August 31 $427 $350
Change in plan assets (in millions):
2014 2013
Plan assets at fair value at September 1 $— $—
Participants’ contributions 6 6
Employer contributions 13 14
Benefits paid (19) (20)
Plan assets at fair value at August 31 $— $—
Funded status (in millions):
2014 2013
Funded status at August 31 $(427) $(350)
Amounts recognized in the Consolidated Balance Sheets (in millions):
2014 2013
Current liabilities (present value of expected 2015 net benefit payments) $ (11) $ (10)
Non-current liabilities (416) (340)
Net liability recognized at August 31 $(427) $(350)
Amounts recognized in accumulated other comprehensive (income) loss (in millions):
2014 2013
Prior service credit $(228) $(228)
Net actuarial loss 225 148
Amounts expected to be recognized as components of net periodic costs for fiscal year 2015 (in millions):
2015
Prior service credit $(24)
Net actuarial loss 19
The measurement date used to determine postretirement benefits is August 31.
The discount rate assumption used to compute the postretirement benefit obligation at year-end was 4.40% for
2014 and 5.20% for 2013. The discount rate assumption used to determine net periodic benefit cost was 5.05%,
4.15% and 5.40% for fiscal years ending 2014, 2013 and 2012, respectively.
87