Walgreens 2014 Annual Report Download - page 71
Download and view the complete annual report
Please find page 71 of the 2014 Walgreens annual report below. You can navigate through the pages in the report by either clicking on the pages listed below, or by using the keyword search tool below to find specific information within the annual report.-
 1
1 -
2
-
3
-
4
-
5
-
6
-
7
-
8
-
9
-
10
-
11
-
12
-
13
-
14
-
15
-
16
-
17
-
18
-
19
-
20
-
21
-
22
-
23
-
24
-
25
-
26
-
27
-
28
-
29
-
30
-
31
-
32
-
33
-
34
-
35
-
36
-
37
-
38
-
39
-
40
-
41
-
42
-
43
-
44
-
45
-
46
-
47
-
48
-
49
-
50
-
51
-
52
-
53
-
54
-
55
-
56
-
57
-
58
-
59
-
60
-
 61
61 -
 62
62 -
 63
63 -
 64
64 -
 65
65 -
 66
66 -
 67
67 -
 68
68 -
 69
69 -
 70
70 -
 71
71 -
 72
72 -
 73
73 -
 74
74 -
 75
75 -
 76
76 -
 77
77 -
 78
78 -
 79
79 -
 80
80 -
 81
81 -
82
-
83
-
84
-
85
-
86
-
87
-
88
-
89
-
90
-
91
-
92
-
93
-
94
-
95
-
96
-
97
-
98
-
99
-
100
-
101
-
102
-
103
-
104
-
105
-
106
-
107
-
108
-
109
-
110
-
111
-
112
-
113
-
114
-
115
-
116
-
117
-
118
-
119
-
120
 |
 |

earnings. Judgment regarding the level of influence over each equity method investment includes considering
key factors such as the Company’s ownership interest, representation on the board of directors, participation in
policy-making decisions and material intercompany transactions.
The Company purchases inventory from Alliance Boots in the ordinary course of business. These related party
inventory purchases, which began in fiscal 2013, were not material in fiscal 2014 or 2013.
The underlying net assets of the Company’s equity method investment in Alliance Boots include goodwill and
indefinite-lived intangible assets. These assets are evaluated for impairment annually or more frequently if an
event occurs or circumstances change that would more likely than not reduce the fair value of a reporting unit
below its carrying value. Based on the Company’s evaluation as of August 31, 2014, the fair value of one
Alliance Boots pharmaceutical wholesale reporting unit did not exceed its carrying amount by a significant
amount. Goodwill allocated to this reporting unit by Alliance Boots as of May 31, 2014 was £255 million,
£115 million based on the Company’s 45% ownership percentage (approximately $193 million using May 31,
2014 exchange rates). The Company utilizes a three-month lag in reporting its share of equity income in Alliance
Boots, including this reporting unit. The Company will continue to monitor this reporting unit in accordance with
Accounting Standards Codification 350, Intangibles – Goodwill and Other.
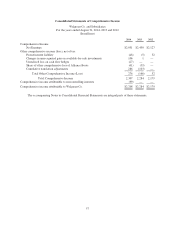
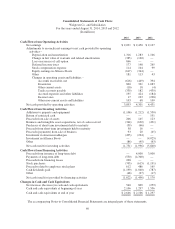
Property and Equipment
Depreciation is provided on a straight-line basis over the estimated useful lives of owned assets. Leasehold
improvements and leased properties under capital leases are amortized over the estimated useful life of the
property or over the term of the lease, whichever is shorter. Estimated useful lives range from 10 to 39 years for
land improvements, buildings and building improvements; and 2 to 13 years for equipment. Major repairs, which
extend the useful life of an asset, are capitalized; routine maintenance and repairs are charged against earnings.
The majority of the business uses the composite method of depreciation for equipment. Therefore, gains and
losses on retirement or other disposition of such assets are included in earnings only when an operating location
is closed, completely remodeled or impaired. Fully depreciated property and equipment are removed from the
cost and related accumulated depreciation and amortization accounts. Property and equipment consists of (in
millions):
2014 2013
Land and land improvements
Owned locations $ 3,059 $ 3,203
Distribution centers 93 97
Other locations 266 219
Buildings and building improvements
Owned locations 3,927 3,805
Leased locations (leasehold improvements only) 2,041 1,811
Distribution centers 582 620
Other locations 351 351
Equipment
Locations 5,454 5,334
Distribution centers 1,170 1,190
Other locations 935 755
Capitalized system development costs 688 581
Capital lease properties 530 215
19,096 18,181
Less: accumulated depreciation and amortization 6,839 6,043
$12,257 $12,138
63