Walgreens 2015 Annual Report Download - page 119
Download and view the complete annual report
Please find page 119 of the 2015 Walgreens annual report below. You can navigate through the pages in the report by either clicking on the pages listed below, or by using the keyword search tool below to find specific information within the annual report.-
 1
1 -
2
-
3
-
4
-
5
-
6
-
7
-
8
-
9
-
10
-
11
-
12
-
13
-
14
-
15
-
16
-
17
-
18
-
19
-
20
-
21
-
22
-
23
-
24
-
25
-
26
-
27
-
28
-
29
-
30
-
31
-
32
-
33
-
34
-
35
-
36
-
37
-
38
-
39
-
40
-
41
-
42
-
43
-
44
-
45
-
46
-
47
-
48
-
49
-
50
-
51
-
52
-
53
-
54
-
55
-
56
-
57
-
58
-
59
-
60
-
61
-
62
-
63
-
64
-
65
-
66
-
67
-
68
-
69
-
70
-
71
-
72
-
73
-
74
-
75
-
76
-
77
-
78
-
79
-
80
-
81
-
82
-
83
-
84
-
85
-
86
-
87
-
88
-
89
-
90
-
91
-
92
-
93
-
94
-
95
-
96
-
97
-
98
-
99
-
100
-
101
-
102
-
103
-
104
-
105
-
106
-
107
-
108
-
 109
109 -
 110
110 -
 111
111 -
 112
112 -
 113
113 -
 114
114 -
 115
115 -
 116
116 -
 117
117 -
 118
118 -
 119
119 -
 120
120 -
 121
121 -
 122
122 -
 123
123 -
 124
124 -
 125
125 -
 126
126 -
 127
127 -
 128
128 -
 129
129 -
130
-
131
-
132
-
133
-
134
-
135
-
136
-
137
-
138
-
139
-
140
-
141
-
142
-
143
-
144
-
145
-
146
-
147
-
148
 |
 |

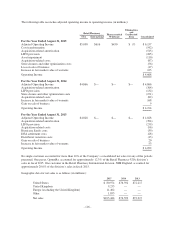
The following table reflects results of operations of the Company’s reportable segments (in millions):
Retail Pharmacy Pharmaceutical
Wholesale
Eliminations
and
Unallocated
Items ConsolidatedUSA International
For the Year Ended August 31, 2015
Sales to external customers $ 80,974 $ 8,657 $ 13,813 $ — $ 103,444
Intersegment sales — 124 1,514 (1,638) —
Total Sales $ 80,974 $ 8,781 $ 15,327 $(1,638) $ 103,444
Adjusted Operating Income $ 5,098 $ 616 $ 450 $ (7) $ 6,157
Depreciation and amortization $ 1,217 $ 393 $ 120 $ 12 $ 1,742
Additions to property, plant and equipment 951 249 51 — 1,251
For the Year Ended August 31, 2014
Sales to external customers $ 76,392 $ — $ — $ — $ 76,392
Intersegment sales — — — — —
Total Sales 76,392 — — — 76,392
Adjusted Operating Income $ 4,866 $ — $ — $ — $ 4,866
Depreciation and amortization $ 1,316 $ — $ — $ — $ 1,316
Additions to property, plant and equipment 1,106 — — — 1,106
For the Year Ended August 31, 2013
Sales to external customers $ 72,217 $ — $ — $ — $ 72,217
Intersegment sales — — — — —
Total Sales 72,217 — — — 72,217
Adjusted Operating Income $ 4,828 $ — $ — $ — $ 4,828
Depreciation and amortization $ 1,283 $ — $ — $ — $ 1,283
Additions to property, plant and equipment 1,212 — — — 1,212
- 115 -