Walgreens 2015 Annual Report Download - page 47
Download and view the complete annual report
Please find page 47 of the 2015 Walgreens annual report below. You can navigate through the pages in the report by either clicking on the pages listed below, or by using the keyword search tool below to find specific information within the annual report.-
 1
1 -
2
-
3
-
4
-
5
-
6
-
7
-
8
-
9
-
10
-
11
-
12
-
13
-
14
-
15
-
16
-
17
-
18
-
19
-
20
-
21
-
22
-
23
-
24
-
25
-
26
-
27
-
28
-
29
-
30
-
31
-
32
-
33
-
34
-
35
-
36
-
 37
37 -
 38
38 -
 39
39 -
 40
40 -
 41
41 -
 42
42 -
 43
43 -
 44
44 -
 45
45 -
 46
46 -
 47
47 -
 48
48 -
 49
49 -
 50
50 -
 51
51 -
 52
52 -
 53
53 -
 54
54 -
 55
55 -
 56
56 -
 57
57 -
58
-
59
-
60
-
61
-
62
-
63
-
64
-
65
-
66
-
67
-
68
-
69
-
70
-
71
-
72
-
73
-
74
-
75
-
76
-
77
-
78
-
79
-
80
-
81
-
82
-
83
-
84
-
85
-
86
-
87
-
88
-
89
-
90
-
91
-
92
-
93
-
94
-
95
-
96
-
97
-
98
-
99
-
100
-
101
-
102
-
103
-
104
-
105
-
106
-
107
-
108
-
109
-
110
-
111
-
112
-
113
-
114
-
115
-
116
-
117
-
118
-
119
-
120
-
121
-
122
-
123
-
124
-
125
-
126
-
127
-
128
-
129
-
130
-
131
-
132
-
133
-
134
-
135
-
136
-
137
-
138
-
139
-
140
-
141
-
142
-
143
-
144
-
145
-
146
-
147
-
148
 |
 |

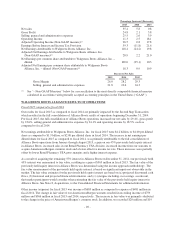
Percent to Total Sales
2015 2014 2013
Gross Margin 26.9 28.2 29.3
Selling, general and administrative expenses 22.5 23.6 24.3
(1) See “– Non-GAAP Measures” below for a reconciliation to the most directly comparable GAAP measure
and related disclosures.
(2) Includes immunizations.
(3) Includes the adjustment to convert prescriptions greater than 84 days to the equivalent of three 30-day
prescriptions. This adjustment reflects the fact that these prescriptions include approximately three times the
amount of product days supplied compared to a normal prescription.
(4) Locations in 2013 include worksite health and wellness centers, which were part of the Take Care Employer
business in which we sold a majority interest in fiscal 2014. Locations in 2014 include infusion and
respiratory service facilities in which we sold a majority interest in fiscal 2015.
Sales fiscal 2015 compared to fiscal 2014
The Retail Pharmacy USA division’s total sales for fiscal 2015 increased by 6.0% to $81.0 billion. Total sales
increased primarily due to higher comparable store sales, which were up 6.4% in fiscal 2015. Comparable
drugstores are defined as those that have been open for at least twelve consecutive months without closure for
seven or more consecutive days and without a major remodel or a natural disaster in the past twelve months.
Relocated and acquired stores are not included as comparable stores for the first twelve months after the
relocation or acquisition. We operated 8,182 locations (8,173 drugstores) as of August 31, 2015, compared to
8,309 locations (8,207 drugstores) a year earlier. Prior year’s locations included 91 infusion and respiratory
services facilities in which we sold a majority interest in fiscal 2015.
Pharmacy sales increased by 8.2% in fiscal 2015 and represented 66.1% of the division’s total sales. In fiscal
2014, pharmacy sales were up 7.9% and represented 64.2% of the division’s total sales. Comparable pharmacy
sales increased 9.3% in fiscal 2015 compared to an increase of 6.8% in fiscal 2014. The effect of generic drugs,
which have a lower retail price, replacing brand name drugs reduced prescription sales by 1.8% in fiscal 2015
versus a reduction of 1.3% in fiscal 2014. The effect of generics on division total sales was a reduction of 1.0%
in fiscal 2015 compared to a reduction of 0.7% for fiscal 2014. Third party sales, where reimbursement is
received from managed care organizations, governmental agencies, employers or private insurers, were 96.8% of
prescription sales for fiscal 2015 compared to 96.5% for fiscal 2014. The total number of prescriptions (including
immunizations) filled in fiscal 2015 was approximately 723 million compared to 699 million in fiscal 2014.
Prescriptions (including immunizations) adjusted to 30 day equivalents were 894 million in fiscal 2015 versus
856 million in fiscal 2014.
Retail sales increased 1.9% in fiscal 2015 and were 33.9% of the division’s total sales. In comparison, fiscal 2014
retail sales increased 2.1% and comprised 35.8% of the division’s total sales. Comparable retail sales increased
1.5% in fiscal 2015 compared to an increase of 2.0% in fiscal 2014. The increase in comparable retail sales in
fiscal 2015 as compared to fiscal 2014 was primarily attributed to an increase in basket size partially offset by
lower customer traffic.
Operating Income fiscal 2015 compared to fiscal 2014
Retail Pharmacy USA division’s operating income for fiscal 2015 decreased 7.2% to $3.9 billion. The decrease is
primarily due to having equity earnings in Alliance Boots for four months in the current year versus twelve
months in the comparable period and current year costs related to the Cost Transformation Program.
Gross margin as a percent of total sales was 26.9% in fiscal 2015 compared to 28.2% in fiscal 2014. Pharmacy
margins were negatively impacted in the current fiscal year by lower third-party reimbursements; an increase in
-43-