Walgreens 2015 Annual Report Download - page 81
Download and view the complete annual report
Please find page 81 of the 2015 Walgreens annual report below. You can navigate through the pages in the report by either clicking on the pages listed below, or by using the keyword search tool below to find specific information within the annual report.-
 1
1 -
2
-
3
-
4
-
5
-
6
-
7
-
8
-
9
-
10
-
11
-
12
-
13
-
14
-
15
-
16
-
17
-
18
-
19
-
20
-
21
-
22
-
23
-
24
-
25
-
26
-
27
-
28
-
29
-
30
-
31
-
32
-
33
-
34
-
35
-
36
-
37
-
38
-
39
-
40
-
41
-
42
-
43
-
44
-
45
-
46
-
47
-
48
-
49
-
50
-
51
-
52
-
53
-
54
-
55
-
56
-
57
-
58
-
59
-
60
-
61
-
62
-
63
-
64
-
65
-
66
-
67
-
68
-
69
-
70
-
 71
71 -
 72
72 -
 73
73 -
 74
74 -
 75
75 -
 76
76 -
 77
77 -
 78
78 -
 79
79 -
 80
80 -
 81
81 -
 82
82 -
 83
83 -
 84
84 -
 85
85 -
 86
86 -
 87
87 -
 88
88 -
 89
89 -
 90
90 -
 91
91 -
92
-
93
-
94
-
95
-
96
-
97
-
98
-
99
-
100
-
101
-
102
-
103
-
104
-
105
-
106
-
107
-
108
-
109
-
110
-
111
-
112
-
113
-
114
-
115
-
116
-
117
-
118
-
119
-
120
-
121
-
122
-
123
-
124
-
125
-
126
-
127
-
128
-
129
-
130
-
131
-
132
-
133
-
134
-
135
-
136
-
137
-
138
-
139
-
140
-
141
-
142
-
143
-
144
-
145
-
146
-
147
-
148
 |
 |

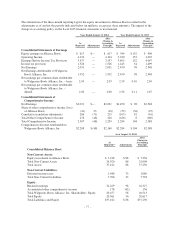
The elimination of the three-month reporting lag for the equity investment in Alliance Boots resulted in the
adjustments as of and for the periods indicated below (in millions, except per share amounts). The impact of the
change in accounting policy on the fiscal 2015 financial statements is not material.
Year Ended August 31, 2014 Year Ended August 31, 2013
As
Reported Adjustments
After
Change in
Accounting
Principle
As
Reported Adjustments
After
Change in
Accounting
Principle
Consolidated Statements of Earnings
Equity earnings in Alliance Boots $ 617 $— $ 617 $ 344 $ 152 $ 496
Operating Income 4,194 — 4,194 3,940 152 4,092
Earnings Before Income Tax Provision 3,557 — 3,557 3,895 152 4,047
Income tax provision 1,526 — 1,526 1,445 54 1,499
Net Earnings 2,031 — 2,031 2,450 98 2,548
Net Earnings Attributable to Walgreens
Boots Alliance, Inc. 1,932 — 1,932 2,450 98 2,548
Net earnings per common share attributable
to Walgreens Boots Alliance, Inc. – basic 2.03 — 2.03 2.59 0.10 2.69
Net earnings per common share attributable
to Walgreens Boots Alliance, Inc. –
diluted 2.00 — 2.00 2.56 0.11 2.67
Consolidated Statements of
Comprehensive Income
Net Earnings $2,031 $— $2,031 $2,450 $ 98 $2,548
Share of other comprehensive income (loss)
of Alliance Boots (41) 23 (18) (59) (36) (95)
Cumulative translation adjustments 286 (71) 215 (103) 42 (61)
Total Other Comprehensive Income 276 (48) 228 (166) 6 (160)
Total Comprehensive Income 2,307 (48) 2,259 2,284 104 2,388
Comprehensive Income Attributable to
Walgreens Boots Alliance, Inc. $2,208 $ (48) $2,160 $2,284 $ 104 $2,388
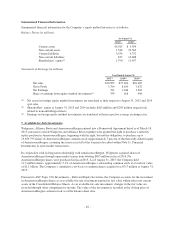
As of August 31, 2014
As
Reported(1) Adjustments
After
Change in
Accounting
Principle
Consolidated Balance Sheet
Non-Current Assets:
Equity investment in Alliance Boots $ 7,248 $ 88 $ 7,336
Total Non-Current Assets 24,920 88 25,008
Total Assets 37,162 88 37,250
Non-Current Liabilities:
Deferred income taxes 1,048 32 1,080
Total Non-Current Liabilities 7,706 32 7,738
Equity:
Retained earnings 22,229 98 22,327
Accumulated other comprehensive income 178 (42) 136
Total Walgreens Boots Alliance, Inc. Shareholders’ Equity 20,457 56 20,513
Total Equity 20,561 56 20,617
Total Liabilities and Equity $37,162 $ 88 $37,250
-77-