Walgreens 2015 Annual Report Download - page 66
Download and view the complete annual report
Please find page 66 of the 2015 Walgreens annual report below. You can navigate through the pages in the report by either clicking on the pages listed below, or by using the keyword search tool below to find specific information within the annual report.-
 1
1 -
2
-
3
-
4
-
5
-
6
-
7
-
8
-
9
-
10
-
11
-
12
-
13
-
14
-
15
-
16
-
17
-
18
-
19
-
20
-
21
-
22
-
23
-
24
-
25
-
26
-
27
-
28
-
29
-
30
-
31
-
32
-
33
-
34
-
35
-
36
-
37
-
38
-
39
-
40
-
41
-
42
-
43
-
44
-
45
-
46
-
47
-
48
-
49
-
50
-
51
-
52
-
53
-
54
-
55
-
 56
56 -
 57
57 -
 58
58 -
 59
59 -
 60
60 -
 61
61 -
 62
62 -
 63
63 -
 64
64 -
 65
65 -
 66
66 -
 67
67 -
 68
68 -
 69
69 -
 70
70 -
 71
71 -
 72
72 -
 73
73 -
 74
74 -
 75
75 -
 76
76 -
77
-
78
-
79
-
80
-
81
-
82
-
83
-
84
-
85
-
86
-
87
-
88
-
89
-
90
-
91
-
92
-
93
-
94
-
95
-
96
-
97
-
98
-
99
-
100
-
101
-
102
-
103
-
104
-
105
-
106
-
107
-
108
-
109
-
110
-
111
-
112
-
113
-
114
-
115
-
116
-
117
-
118
-
119
-
120
-
121
-
122
-
123
-
124
-
125
-
126
-
127
-
128
-
129
-
130
-
131
-
132
-
133
-
134
-
135
-
136
-
137
-
138
-
139
-
140
-
141
-
142
-
143
-
144
-
145
-
146
-
147
-
148
 |
 |

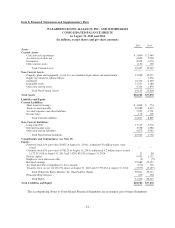
WALGREENS BOOTS ALLIANCE, INC. AND SUBSIDIARIES
CONSOLIDATED STATEMENTS OF EQUITY
For the years ended August 31, 2015, 2014 and 2013
(In millions, except shares and per share amounts)
Equity attributable to Walgreens Boots Alliance, Inc.
Common
Stock
Shares
Common
Stock
Amount
Treasury
Stock
Amount
Paid-In
Capital
Employee
Stock
Loan
Receivable
Accumulated
Other
Comprehensive
Income (Loss)
Retained
Earnings
Noncontrolling
Interests
Total
Equity
August 31, 2012 944,055,334 $ 80 $(2,985) $ 936 $ (19) $ 68 $20,156 $ — $18,236
Net earnings — — — — — — 2,548 — 2,548
Other comprehensive income,
net of tax — — — — — (160) — — (160)
Dividends declared ($1.14 per
share) — — — — — — (1,083) — (1,083)
Treasury stock purchases (13,797,490) — (615) — — — — — (615)
Employee stock purchase and
option plans 16,337,734 — 486 34 — — — — 520
Stock-based compensation — — — 104 — — — — 104
Employee stock loan
receivable — — — — 8 — — — 8
August 31, 2013 946,595,578 $ 80 $(3,114) $ 1,074 $ (11) $ (92) $21,621 $ — $19,558
Net earnings — — — — — — 1,932 99 2,031
Other comprehensive income,
net of tax — — — — — 228 — — 228
Dividends declared ($1.28 per
share) — — — — — — (1,226) — (1,226)
Treasury stock purchases (11,810,351) — (705) — — — — — (705)
Employee stock purchase and
option plans 15,601,662 — 622 (16) — — — — 606
Stock-based compensation — — — 114 — — — — 114
Employee stock loan
receivable — — — — 6 — — — 6
Other — — — — — — — 5 5
August 31, 2014 950,386,889 $ 80 $(3,197) $ 1,172 $ (5) $ 136 $22,327 $ 104 $20,617
Net earnings — — — — — — 4,220 59 4,279
Other comprehensive income,
net of tax — — — — — (350) — (6) (356)
Dividends declared ($1.37 per
share) — — — — — — (1,458) — (1,458)
Exchange of Walgreen Co.
shares for Walgreens Boots
Alliance, Inc. shares — (69) — 69 — — — — —
Issuance of shares for Alliance
Boots acquisition 144,333,468 1 — 10,976 — — — — 10,977
Treasury stock purchases (16,250,190) — (1,226) — — — — — (1,226)
Employee stock purchase and
option plans 11,440,177 — 446 56 — — — — 502
Stock-based compensation — — — 109 — — — — 109
Acquisition of noncontrolling
interest — — — (2,429) — — — (130) (2,559)
Employee stock loan
receivable — — — — 3 — — — 3
Noncontrolling interests in
businesses acquired — — — — — — — 412 412
August 31, 2015 1,089,910,344 $ 12 $(3,977) $ 9,953 $ (2) $(214) $25,089 $ 439 $31,300
The accompanying Notes to Consolidated Financial Statements are an integral part of these Statements.
-62-