Walgreens 2015 Annual Report Download - page 39
Download and view the complete annual report
Please find page 39 of the 2015 Walgreens annual report below. You can navigate through the pages in the report by either clicking on the pages listed below, or by using the keyword search tool below to find specific information within the annual report.-
 1
1 -
2
-
3
-
4
-
5
-
6
-
7
-
8
-
9
-
10
-
11
-
12
-
13
-
14
-
15
-
16
-
17
-
18
-
19
-
20
-
21
-
22
-
23
-
24
-
25
-
26
-
27
-
28
-
 29
29 -
 30
30 -
 31
31 -
 32
32 -
 33
33 -
 34
34 -
 35
35 -
 36
36 -
 37
37 -
 38
38 -
 39
39 -
 40
40 -
 41
41 -
 42
42 -
 43
43 -
 44
44 -
 45
45 -
 46
46 -
 47
47 -
 48
48 -
 49
49 -
50
-
51
-
52
-
53
-
54
-
55
-
56
-
57
-
58
-
59
-
60
-
61
-
62
-
63
-
64
-
65
-
66
-
67
-
68
-
69
-
70
-
71
-
72
-
73
-
74
-
75
-
76
-
77
-
78
-
79
-
80
-
81
-
82
-
83
-
84
-
85
-
86
-
87
-
88
-
89
-
90
-
91
-
92
-
93
-
94
-
95
-
96
-
97
-
98
-
99
-
100
-
101
-
102
-
103
-
104
-
105
-
106
-
107
-
108
-
109
-
110
-
111
-
112
-
113
-
114
-
115
-
116
-
117
-
118
-
119
-
120
-
121
-
122
-
123
-
124
-
125
-
126
-
127
-
128
-
129
-
130
-
131
-
132
-
133
-
134
-
135
-
136
-
137
-
138
-
139
-
140
-
141
-
142
-
143
-
144
-
145
-
146
-
147
-
148
 |
 |

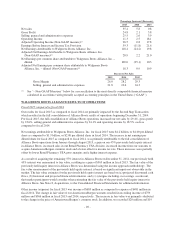
Item 6. Selected Financial Data
Five-Year Summary of Selected Consolidated Financial Data
Walgreens Boots Alliance, Inc. and Subsidiaries
(Dollars in Millions, except per share amounts)
Fiscal Year 2015 2014 2013 2012 2011
Net sales $103,444 $76,392 $72,217 $71,633 $72,184
Cost of sales 76,520 54,823 51,098 51,291 51,692
Gross Profit 26,924 21,569 21,119 20,342 20,492
Selling, general and administrative expenses 22,571 17,992 17,543 16,878 16,561
Gain on sale of business(1) — — 20 — 434
Equity earnings in Alliance Boots(2) 315 617 496 — —
Operating Income 4,668 4,194 4,092 3,464 4,365
Gain on previously held equity interest(3) 563————
Other income (expense)(4) 685 (481) 120 — —
Earnings Before Interest and Income Tax Provision 5,916 3,713 4,212 3,464 4,365
Interest expense, net 605 156 165 88 71
Earnings Before Income Tax Provision 5,311 3,557 4,047 3,376 4,294
Income tax provision 1,056 1,526 1,499 1,249 1,580
Post tax earnings from equity method investments 24 ————
Net Earnings 4,279 2,031 2,548 2,127 2,714
Net earnings attributable to noncontrolling interests 59 99 — — —
Net Earnings attributable to Walgreens Boots Alliance, Inc. $ 4,220 $ 1,932 $ 2,548 $ 2,127 $ 2,714
Per Common Share
Net earnings
Basic $ 4.05 $ 2.03 $ 2.69 $ 2.43 $ 2.97
Diluted 4.00 2.00 2.67 2.42 2.94
Dividends declared 1.37 1.28 1.14 0.95 0.75
Balance Sheet
Total Assets $ 68,782 $37,250 $35,632 $33,453 $27,446
Long-term debt 13,315 3,716 4,451 4,066 2,387
Total Walgreens Boots Alliance, Inc. Shareholders’ Equity 30,861 20,513 19,558 18,236 14,847
Noncontrolling interests 439 104 — — —
Total Equity 31,300 20,617 19,558 18,236 14,847
(1) In fiscal 2011, the Company sold its pharmacy benefit management business, Walgreens Health Initiatives,
Inc., to Catalyst Health Solutions, Inc. and recorded a pre-tax gain of $434 million. In fiscal 2013, the
Company recorded an additional pre-tax gain of $20 million relating to a client retention escrow.
(2) On August 2, 2012, the Company completed the acquisition of 45% of the issued and outstanding share
capital of Alliance Boots GmbH (Alliance Boots) in exchange for cash and Company shares. The Company
accounted for this investment under the equity method until the completion of the Second Step Transaction
on December 31, 2014. As a result, fiscal 2015 includes the results of Alliance Boots for eight months
(January through August 2015) on a fully consolidated basis and four months (September through
December 2014) as equity earnings in Alliance Boots reflecting Walgreens’ pre-closing 45 percent interest.
(3) In fiscal 2015, as a result of acquiring the remaining 55% interest in Alliance Boots, our previously held
45% interest was remeasured to fair value, resulting in a gain of $563 million.
(4) In fiscal 2014, the Company recognized a non-cash loss of $866 million related to the amendment and
exercise of the Alliance Boots call option to acquire the remaining 55% share capital of Alliance Boots. In
addition, in fiscal 2015, 2014 and 2013, the Company recorded pre-tax income of $779 million, $385
million and $120 million, respectively, from fair value adjustments of the AmerisourceBergen warrants and
the amortization of the deferred credit associated with the initial value of the warrants. Fiscal 2015 also
includes a $94 million loss on derivative contracts that were not designated as accounting hedges.
-35-