Walgreens 2015 Annual Report Download - page 46
Download and view the complete annual report
Please find page 46 of the 2015 Walgreens annual report below. You can navigate through the pages in the report by either clicking on the pages listed below, or by using the keyword search tool below to find specific information within the annual report.-
 1
1 -
2
-
3
-
4
-
5
-
6
-
7
-
8
-
9
-
10
-
11
-
12
-
13
-
14
-
15
-
16
-
17
-
18
-
19
-
20
-
21
-
22
-
23
-
24
-
25
-
26
-
27
-
28
-
29
-
30
-
31
-
32
-
33
-
34
-
35
-
 36
36 -
 37
37 -
 38
38 -
 39
39 -
 40
40 -
 41
41 -
 42
42 -
 43
43 -
 44
44 -
 45
45 -
 46
46 -
 47
47 -
 48
48 -
 49
49 -
 50
50 -
 51
51 -
 52
52 -
 53
53 -
 54
54 -
 55
55 -
 56
56 -
57
-
58
-
59
-
60
-
61
-
62
-
63
-
64
-
65
-
66
-
67
-
68
-
69
-
70
-
71
-
72
-
73
-
74
-
75
-
76
-
77
-
78
-
79
-
80
-
81
-
82
-
83
-
84
-
85
-
86
-
87
-
88
-
89
-
90
-
91
-
92
-
93
-
94
-
95
-
96
-
97
-
98
-
99
-
100
-
101
-
102
-
103
-
104
-
105
-
106
-
107
-
108
-
109
-
110
-
111
-
112
-
113
-
114
-
115
-
116
-
117
-
118
-
119
-
120
-
121
-
122
-
123
-
124
-
125
-
126
-
127
-
128
-
129
-
130
-
131
-
132
-
133
-
134
-
135
-
136
-
137
-
138
-
139
-
140
-
141
-
142
-
143
-
144
-
145
-
146
-
147
-
148
 |
 |

Interest was a net expense of $156 million and $165 million in fiscal 2014 and 2013, respectively. The decrease
in fiscal 2014 interest expense as compared to fiscal 2013 was due to the repayment of notes that matured in
fiscal 2014 partially offset by higher interest charges related to incremental capital and finance lease obligations.
The effective tax rate for fiscal 2014 and 2013 was 42.9% and 37.0%, respectively. The increase in the fiscal
2014 effective tax rate as compared to fiscal 2013 was primarily attributable to the loss associated with the
Company’s option to purchase the remaining equity interest in Alliance Boots, which did not generate a tax
benefit in fiscal 2014, partially offset by the favorable impact of additional foreign source income taxed at lower
rates.
Walgreens Boots Alliance Adjusted Net Earnings Per Diluted Share (Non-GAAP measure)
Adjusted net earnings per diluted share for fiscal 2014 were $3.28 compared to $3.25 in fiscal 2013. The increase
in adjusted net earnings per diluted share for the fiscal 2014 as compared to fiscal 2013 was primarily attributed
to higher sales, lower selling, general and administrative expenses as a percentage of sales, and increased equity
earnings in Alliance Boots, partially offset by lower gross margins in our Retail Pharmacy USA division. See
“– Non-GAAP Measures” below for a reconciliation to the most directly comparable GAAP measure.
RESULTS OF OPERATIONS BY SEGMENT
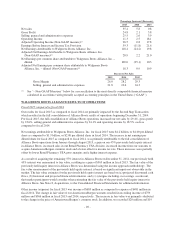
Retail Pharmacy USA
All periods have been recasted for removal of the three-month reporting lag previously applied to reporting
equity earnings in Alliance Boots. Additionally, as a result of the completion of the Second Step Transaction, the
Company ceased recording equity earnings in Alliance Boots as of December 31, 2014. As such, fiscal 2015
includes equity earnings in Alliance Boots from September 1, 2014 through December 31, 2014.
(in millions, except location amounts)
2015 2014 2013
Total Sales $80,974 $76,392 $72,217
Gross Profit 21,822 21,569 21,119
Selling, general and administrative expenses 18,247 17,992 17,543
Operating Income 3,890 4,194 4,092
Adjusted Operating Income (Non-GAAP measure)(1) 5,098 4,866 4,828
Number of Prescriptions(2) 723 699 683
30 Day Equivalent Prescriptions(2)(3) 894 856 821
Number of Locations at period end(4) 8,182 8,309 8,582
Percentage Increases/(Decreases)
2015 2014 2013
Total Sales 6.0 5.8 0.8
Gross Profit 1.2 2.1 3.8
Selling, general and administrative expenses 1.4 2.6 3.9
Operating Income (7.2) 2.5 18.1
Adjusted Operating Income (Non-GAAP measure)(1) 4.8 0.8 17.8
Comparable Drugstore Sales 6.4 4.9 (1.3)
Pharmacy Sales 8.2 7.9 0.4
Comparable Pharmacy Sales 9.3 6.8 (1.7)
Retail Sales 1.9 2.1 1.5
Comparable Retail Sales 1.5 2.0 (0.7)
Comparable Number of Prescriptions(2) 3.5 1.8 1.1
Comparable 30 Day Equivalent Prescriptions(2)(3) 4.6 3.9 3.2
-42-