Walgreens 2015 Annual Report Download - page 51
Download and view the complete annual report
Please find page 51 of the 2015 Walgreens annual report below. You can navigate through the pages in the report by either clicking on the pages listed below, or by using the keyword search tool below to find specific information within the annual report.-
 1
1 -
2
-
3
-
4
-
5
-
6
-
7
-
8
-
9
-
10
-
11
-
12
-
13
-
14
-
15
-
16
-
17
-
18
-
19
-
20
-
21
-
22
-
23
-
24
-
25
-
26
-
27
-
28
-
29
-
30
-
31
-
32
-
33
-
34
-
35
-
36
-
37
-
38
-
39
-
40
-
 41
41 -
 42
42 -
 43
43 -
 44
44 -
 45
45 -
 46
46 -
 47
47 -
 48
48 -
 49
49 -
 50
50 -
 51
51 -
 52
52 -
 53
53 -
 54
54 -
 55
55 -
 56
56 -
 57
57 -
 58
58 -
 59
59 -
 60
60 -
 61
61 -
62
-
63
-
64
-
65
-
66
-
67
-
68
-
69
-
70
-
71
-
72
-
73
-
74
-
75
-
76
-
77
-
78
-
79
-
80
-
81
-
82
-
83
-
84
-
85
-
86
-
87
-
88
-
89
-
90
-
91
-
92
-
93
-
94
-
95
-
96
-
97
-
98
-
99
-
100
-
101
-
102
-
103
-
104
-
105
-
106
-
107
-
108
-
109
-
110
-
111
-
112
-
113
-
114
-
115
-
116
-
117
-
118
-
119
-
120
-
121
-
122
-
123
-
124
-
125
-
126
-
127
-
128
-
129
-
130
-
131
-
132
-
133
-
134
-
135
-
136
-
137
-
138
-
139
-
140
-
141
-
142
-
143
-
144
-
145
-
146
-
147
-
148
 |
 |

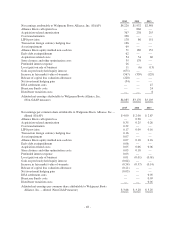
(1) Includes $106 million (Retail Pharmacy International $100 million and Pharmaceutical Wholesale $6
million) of inventory fair value adjustment. No additional fair value adjustment related to the inventory step-
up is expected in future periods.
(in millions)
2014
Retail
Pharmacy
USA
Retail
Pharmacy
International
Pharmaceutical
Wholesale
Eliminations
and Other
Walgreens
Boots
Alliance, Inc.
Operating Income (GAAP) $4,194 $— $— $— $4,194
Acquisition-related amortization 364 — — — 364
Store closures and other optimization costs 271 — — — 271
LIFO provision 132 — — — 132
Acquisition-related costs 82 — — — 82
Increase in fair market value of warrants (168) — — — (168)
Gain on sale of business (9) (9)
Adjusted Operating Income (Non-GAAP
measure) $4,866 $— $— $— $4,866
(in millions)
2013
Retail
Pharmacy
USA
Retail
Pharmacy
International
Pharmaceutical
Wholesale
Eliminations
and Other
Walgreens
Boots
Alliance, Inc.
Operating Income (GAAP) $4,092 $— $— $— $4,092
Acquisition-related amortization 394 — — — 394
LIFO provision 239 — — — 239
Acquisition-related costs 96 — — — 96
Hurricane Sandy costs 39 — — — 39
DEA settlement costs 28 — — — 28
Distributor transition costs 13 — — — 13
Increase in fair market value of warrants (53) — — — (53)
Gain on sale of business (20) — — — (20)
Adjusted Operating Income (Non-GAAP
measure) $4,828 $— $— $— $4,828
-47-