Walgreens 2015 Annual Report Download - page 43
Download and view the complete annual report
Please find page 43 of the 2015 Walgreens annual report below. You can navigate through the pages in the report by either clicking on the pages listed below, or by using the keyword search tool below to find specific information within the annual report.-
 1
1 -
2
-
3
-
4
-
5
-
6
-
7
-
8
-
9
-
10
-
11
-
12
-
13
-
14
-
15
-
16
-
17
-
18
-
19
-
20
-
21
-
22
-
23
-
24
-
25
-
26
-
27
-
28
-
29
-
30
-
31
-
32
-
 33
33 -
 34
34 -
 35
35 -
 36
36 -
 37
37 -
 38
38 -
 39
39 -
 40
40 -
 41
41 -
 42
42 -
 43
43 -
 44
44 -
 45
45 -
 46
46 -
 47
47 -
 48
48 -
 49
49 -
 50
50 -
 51
51 -
 52
52 -
 53
53 -
54
-
55
-
56
-
57
-
58
-
59
-
60
-
61
-
62
-
63
-
64
-
65
-
66
-
67
-
68
-
69
-
70
-
71
-
72
-
73
-
74
-
75
-
76
-
77
-
78
-
79
-
80
-
81
-
82
-
83
-
84
-
85
-
86
-
87
-
88
-
89
-
90
-
91
-
92
-
93
-
94
-
95
-
96
-
97
-
98
-
99
-
100
-
101
-
102
-
103
-
104
-
105
-
106
-
107
-
108
-
109
-
110
-
111
-
112
-
113
-
114
-
115
-
116
-
117
-
118
-
119
-
120
-
121
-
122
-
123
-
124
-
125
-
126
-
127
-
128
-
129
-
130
-
131
-
132
-
133
-
134
-
135
-
136
-
137
-
138
-
139
-
140
-
141
-
142
-
143
-
144
-
145
-
146
-
147
-
148
 |
 |

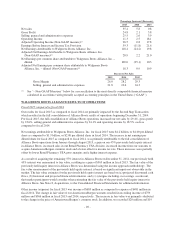
Restructuring costs by segment were as follows (in millions):
Retail Pharmacy
USA International
Pharmaceutical
Wholesale Consolidated
Fiscal 2015
Asset impairments $216 $ 7 $— $223
Real estate costs 219 — — 219
Severance and other business transition and exit costs 105 12 — 117
Total restructuring costs 540 $ 19 $— $559
Fiscal 2014
Real estate costs $137 $— $— $137
Asset impairments 71 — — 71
Severance and other business transition and exit costs 1 — — 1
Total restructuring costs $209 $— $— $209
As the program is implemented, the restructuring charges will be recognized as the costs are incurred over time
in accordance with GAAP. See Note 19, Segment Reporting, to the Consolidated Financial Statements for
additional information.
The amounts and timing of all estimates are subject to change. The actual amounts and timing may vary
materially based on various factors. See “Cautionary Note Regarding Forward-Looking Statements” below.
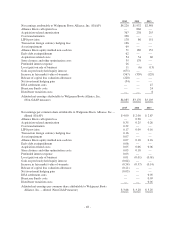
EXECUTIVE SUMMARY
The following table presents certain key financial statistics for the Company for fiscal 2015, 2014 and 2013. All
periods have been recast to reflect the removal of the three-month reporting lag applied to reporting equity
earnings in Alliance Boots prior to December 31, 2014. Additionally, as a result of the completion of the Second
Step Transaction, Alliance Boots became a consolidated subsidiary and the Company ceased recording equity
earnings in Alliance Boots on December 31, 2014. As a result, fiscal 2015 includes the results of Alliance Boots
for eight months (January through August 2015) on a fully consolidated basis and four months (September
through December 2014) as equity earnings in Alliance Boots reflecting Walgreens’ pre-closing 45 percent
interest.
(in millions, except per share amounts)
2015 2014 2013
Net sales $103,444 $76,392 $72,217
Gross Profit 26,924 21,569 21,119
Selling, general and administrative expenses 22,571 17,992 17,543
Operating Income 4,668 4,194 4,092
Adjusted Operating Income (Non-GAAP measure)(1) 6,157 4,866 4,828
Earnings Before Interest and Income Tax Provision 5,916 3,713 4,212
Net Earnings Attributable to Walgreens Boots Alliance, Inc. 4,220 1,932 2,548
Adjusted Net Earnings Attributable to Walgreens Boots Alliance, Inc.
(Non-GAAP measure)(1) 4,085 3,170 3,103
Net Earnings per common share attributable to Walgreens Boots Alliance,
Inc. – diluted 4.00 2.00 2.67
Adjusted Net Earnings per common share attributable to Walgreens Boots
Alliance, Inc. – diluted (Non-GAAP measure)(1) 3.88 3.28 3.25
-39-