Walmart 2014 Annual Report Download - page 22
Download and view the complete annual report
Please find page 22 of the 2014 Walmart annual report below. You can navigate through the pages in the report by either clicking on the pages listed below, or by using the keyword search tool below to find specific information within the annual report.-
 1
1 -
2
-
3
-
4
-
5
-
6
-
7
-
8
-
9
-
10
-
11
-
 12
12 -
 13
13 -
 14
14 -
 15
15 -
 16
16 -
 17
17 -
 18
18 -
 19
19 -
 20
20 -
 21
21 -
 22
22 -
 23
23 -
 24
24 -
 25
25 -
 26
26 -
 27
27 -
 28
28 -
 29
29 -
 30
30 -
 31
31 -
 32
32 -
33
-
34
-
35
-
36
-
37
-
38
-
39
-
40
-
41
-
42
-
43
-
44
-
45
-
46
-
47
-
48
-
49
-
50
-
51
-
52
-
53
-
54
-
55
-
56
-
57
-
58
-
59
-
60
-
61
-
62
-
63
-
64
-
65
-
66
-
67
-
68
 |
 |

Management’s Discussion and Analysis of
Financial Condition and Results of Operations
We made certain reclassications to prior period amounts or balances to
conform to the presentation in the current scal year. These reclassications
did not impact the Company’s operating income or consolidated net
income. Additionally, certain prior period segment asset and expense
allocations have been reclassied among segments to be comparable
with the current period presentation.
The Retail Industry
We operate in the highly competitive retail industry in all of the countries
we serve. We face strong sales competition from other discount, depart-
ment, drug, dollar, variety and specialty stores, warehouse clubs and
supermarkets, as well as internet-based retailers and catalog businesses.
Many of these competitors are national, regional or international chains.
We compete with a number of companies for prime retail site locations,
as well as in attracting and retaining quality employees (whom we call
“associates”). We, along with other retail companies, are inuenced by a
number of factors including, but not limited to: catastrophic events,
climate change, competitive pressures, consumer disposable income,
consumer debt levels and buying patterns, consumer credit availability,
cost of goods, currency exchange rate uctuations, customer preferences,
deation, fuel and energy prices, general economic conditions, ination,
insurance costs, interest rates, labor costs, tax rates, unemployment and
weather patterns. Further information on the factors that can aect our
operating results and on certain risks to our Company and an investment
in its securities can be located in “Item 1A. Risk Factors” in our Annual
Report on Form 10-K for the scal year ended January 31, 2014, and in the
discussion under “Forward-Looking Statements.”
Company Performance Metrics
The Company’s performance metrics emphasize three priorities for
improving shareholder value: growth, leverage and returns. The
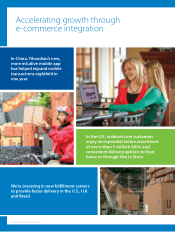
Company’s priority of growth focuses on sales through comparable store
and club sales, including e-commerce sales, and unit square feet growth;
the priority of leverage encompasses the Company’s objective to
increase its operating income at a faster rate than the growth in net sales
by growing its operating, selling, general and administrative expenses
(“operating expenses”) at a slower rate than the growth of its net sales;
and the priority of returns focuses on how eciently the Company
employs its assets through return on investment and how eectively the
Company manages working capital through free cash ow.
Growth
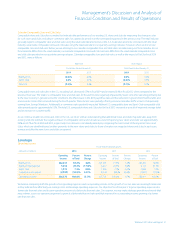
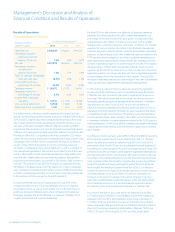
Net Sales
Fiscal Years Ended January 31,
(Amounts in millions) 2014 2013 2012
Percent Percent Percent Percent Percent
Net Sales of Total Change Net Sales of Total Change Net Sales of Total
Walmart U.S. $279,406 59.0% 1.8% $274,433 59.0% 3.9% $264,186 59.6%
Walmart International 136,513 28.9% 1.3% 134,748 28.9% 7.4% 125,435 28.3%
Sam’s Club 57,157 12.1% 1.3% 56,423 12.1% 4.9% 53,795 12.1%
Net sales $473,076 100.0% 1.6% $465,604 100.0% 5.0% $443,416 100.0%
Our consolidated net sales increased 1.6% and 5.0% for scal 2014 and 2013, respectively, when compared to the previous scal year. The increase
in net sales for scal 2014 was primarily due to 3.1% year-over-year growth in retail square feet, higher e-commerce sales, the impact of scal 2013
acquisitions, which accounted for $730 million of the net sales increase, and positive comparable club sales at Sam’s Club. The positive eect of these
items was partially oset by $5.1 billion of negative impact from uctuations in currency exchange rates and decreases in comparable store sales at
Walmart U.S. and in a number of our international operations. The increase in net sales for scal 2013 was due to 3.3% growth in retail square feet
and positive comparable store and club sales. Additionally, net sales from acquisitions, through their respective anniversary dates, accounted for
$4.0 billion of the increase in net sales. The increase in net sales for scal 2013 was partially oset by $4.5 billion of negative impact from uctuations in
currency exchange rates.
20 Walmart 2014 Annual Report