Walmart 2014 Annual Report Download - page 30
Download and view the complete annual report
Please find page 30 of the 2014 Walmart annual report below. You can navigate through the pages in the report by either clicking on the pages listed below, or by using the keyword search tool below to find specific information within the annual report.-
 1
1 -
2
-
3
-
4
-
5
-
6
-
7
-
8
-
9
-
10
-
11
-
12
-
13
-
14
-
15
-
16
-
17
-
18
-
19
-
 20
20 -
 21
21 -
 22
22 -
 23
23 -
 24
24 -
 25
25 -
 26
26 -
 27
27 -
 28
28 -
 29
29 -
 30
30 -
 31
31 -
 32
32 -
 33
33 -
 34
34 -
 35
35 -
 36
36 -
 37
37 -
 38
38 -
 39
39 -
 40
40 -
41
-
42
-
43
-
44
-
45
-
46
-
47
-
48
-
49
-
50
-
51
-
52
-
53
-
54
-
55
-
56
-
57
-
58
-
59
-
60
-
61
-
62
-
63
-
64
-
65
-
66
-
67
-
68
 |
 |

Management’s Discussion and Analysis of
Financial Condition and Results of Operations
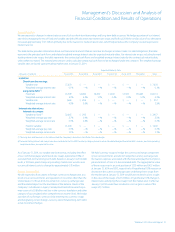
The following table represents the allocation of our capital expenditures
for property and equipment:
Allocation of Capital Expenditures
(Amounts in millions) Fiscal Years Ending January 31,
Capital Expenditures 2014 2013
New stores and clubs, including
expansions and relocations $ 5,083 $ 4,340
Information systems, distribution,
e-commerce and other 2,539 2,922
Remodels 1,030 995
Total U.S. 8,652 8,257
Walmart International 4,463 4,641
Total capital expenditures $13,115 $12,898
Cash Flows Used in Financing Activities
Cash ows used in nancing activities generally consist of transactions
related to our short-term and long-term debt, as well as dividends paid
and the repurchase of Company stock. Transactions with noncontrolling
interest shareholders are also classied as cash ows from nancing activities.
Short-term Borrowings
Short-term borrowings increased $911 million for scal 2014, compared
to an increase of $2.8 billion for the previous scal year. Favorable interest
rates available to us have allowed us to continue to utilize the liquidity
under our short-term borrowing programs to provide funding used for our
operations, dividend payments, share repurchases, capital expenditures
and for other cash requirements and corporate purposes as needed.
Long-term Debt
Information on signicant long-term debt issued during scal 2014,
is as follows:
(Amounts in millions) Maturity Interest Principal
Issue Date Date Rate Amount
April 11, 2013 April 11, 2016 0.600% $1,000
April 11, 2013 April 11, 2018 1.125% 1,250
April 11, 2013 April 11, 2023 2.550% 1,750
April 11, 2013 April 11, 2043 4.000% 1,000
October 2, 2013 December 15, 2018 1.950% 1,000
October 2, 2013 October 2, 2043 4.750% 750
Total $6,750
The aggregate net proceeds from these long-term debt issuances were
approximately $6.7 billion, which were used to pay down and renance
existing debt and for other general corporate purposes. We also received
additional aggregate net proceeds of approximately $0.4 billion from
other, smaller long-term debt issuances in several of our international
operations, which were used primarily to renance existing debt.
Dividends
Our total dividend payments were $6.1 billion, $5.4 billion, and $5.0 billion
for scal 2014, 2013 and 2012, respectively. On February 20, 2014, the Board
of Directors approved the scal 2015 annual dividend at $1.92 per share,
an increase compared to the scal 2014 dividend of $1.88 per share. For
scal 2015, the annual dividend will be paid in four quarterly installments
of $0.48 per share, according to the following record and payable dates:
Record Date Payable Date
March 11, 2014 April 1, 2014
May 9, 2014 June 2, 2014
August 8, 2014 September 3, 2014
December 5, 2014 January 5, 2015
Company Share Repurchase Program
From time to time, the Company repurchases shares of its common stock
under share repurchase programs authorized by the Board of Directors.
On June 6, 2013, the Company’s Board of Directors replaced the previous
$15.0 billion share repurchase program, which had approximately
$712 million of remaining authorization for share repurchases as of that
date, with a new $15.0 billion share repurchase program, which was
announced on June 7, 2013. As was the case with the replaced share
repurchase program, the current share repurchase program has no
expiration date or other restrictions limiting the period over which the
Company can make share repurchases. At January 31, 2014, authorization
for $11.3 billion of share repurchases remained under the current share
repurchase program. Any repurchased shares are constructively retired
and returned to an unissued status.
The Company considers several factors in determining when to execute
share repurchases, including, among other things, current cash needs,
capacity for leverage, cost of borrowings and the market price of its
common stock. The following table provides, on a settlement date basis,
the number of shares repurchased, average price paid per share and
total cash paid for share repurchases for scal 2014, 2013 and 2012:
(Amounts in millions, Fiscal Years Ended January 31,
except per share data) 2014 2013 2012
Total number of shares repurchased 89.1 113.2 115.3
Average price paid per share $74.99 $67.15 $54.64
Total cash paid for share repurchases $6,683 $7,600 $6,298
28 Walmart 2014 Annual Report