Walmart 2014 Annual Report Download - page 28
Download and view the complete annual report
Please find page 28 of the 2014 Walmart annual report below. You can navigate through the pages in the report by either clicking on the pages listed below, or by using the keyword search tool below to find specific information within the annual report.-
 1
1 -
2
-
3
-
4
-
5
-
6
-
7
-
8
-
9
-
10
-
11
-
12
-
13
-
14
-
15
-
16
-
17
-
 18
18 -
 19
19 -
 20
20 -
 21
21 -
 22
22 -
 23
23 -
 24
24 -
 25
25 -
 26
26 -
 27
27 -
 28
28 -
 29
29 -
 30
30 -
 31
31 -
 32
32 -
 33
33 -
 34
34 -
 35
35 -
 36
36 -
 37
37 -
 38
38 -
39
-
40
-
41
-
42
-
43
-
44
-
45
-
46
-
47
-
48
-
49
-
50
-
51
-
52
-
53
-
54
-
55
-
56
-
57
-
58
-
59
-
60
-
61
-
62
-
63
-
64
-
65
-
66
-
67
-
68
 |
 |

Management’s Discussion and Analysis of
Financial Condition and Results of Operations
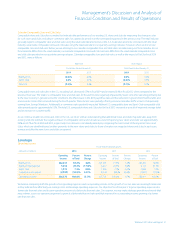
Operating expenses as a percentage of segment net sales decreased
22 basis points in scal 2013, when compared to the previous scal year.
Walmart International leveraged operating expenses in scal 2013 pri-
marily due to expense management. While each country is focused on
leveraging operating expenses, the countries that generated the most
leverage included Brazil, Chile and the United Kingdom in scal 2013.
As a result of the factors discussed above, segment operating income
was $5.5 billion, $6.6 billion and $6.1 billion for scal 2014, 2013 and 2012,
respectively. Fluctuations in currency exchange rates negatively
impacted operating income $26 million and $111 million in scal 2014
and scal 2013, respectively, and positively impacted operating income
$105 million in scal 2012. Walmart International did not grow operating
income faster than net sales in scal 2014, but grew operating income
faster than net sales in scal 2013.
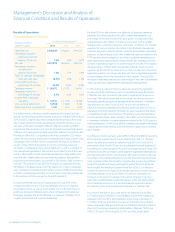
Sam’s Club Segment
We believe the information in the following table under the caption
“Excluding Fuel” is useful to investors because it permits investors to
understand the eect of the Sam’s Club segment’s fuel sales on its
results of operations, which are impacted by the volatility of fuel prices.
Volatility in fuel prices may continue to impact the operating results
of the Sam’s Club segment in the future.
(Amounts in millions, Fiscal Years Ended January 31,
except unit counts) 2014 2013 2012
Including Fuel
Net sales $57,157 $56,423 $53,795
Percentage change from
comparable period 1.3% 4.9% 8.8%
Calendar comparable
club sales increase 0.3% 4.1% 8.4%
Operating income $ 1,975 $ 1,960 $ 1,844
Operating income as
a percentage of net sales 3.5% 3.5% 3.4%
Unit counts at period end 632 620 611
Retail square feet at period end 84 83 82
Excluding Fuel
Net sales $50,574 $49,789 $47,616
Percentage change from
previous scal year 1.6% 4.6% 5.4%
Operating income $ 1,949 $ 1,913 $ 1,805
Operating income as
a percentage of net sales 3.9% 3.8% 3.8%
Net sales for the Sam’s Club segment increased 1.3% and 4.9% for scal
2014 and 2013, respectively, when compared to the previous scal year.
The scal 2014 increase in net sales was due to year-over-year growth in
retail square feet of 2.1%, driven by the addition of 12 new clubs, as well
as positive comparable club sales of 0.3%. Our positive comparable
club sales were the result of increased member trac primarily coming
from our Savings Members, partially oset by severe winter storms that
occurred in the fourth quarter. The net sales increase in scal 2013 was
primarily due to positive comparable club sales, driven by an increase
in customer trac and average ticket. The addition of nine new clubs
in scal 2013 also helped increase net sales.
Gross prot rate was at for scal 2014 and 2013, when compared to the
previous scal year. For scal 2014, our gross prot was negatively impacted
by $39 million from an adjustment to our product warranty liabilities,
which was oset by a favorable impact from merchandise mix.
Membership and other income increased 14.1% and 3.0% for scal
2014 and 2013, respectively, when compared to the previous scal year.
The scal 2014 increase was primarily due to the improved contract terms
relating to the prot sharing arrangement with our credit card provider,
increased membership fees that were introduced on May 15, 2013,
$24 million of income from the sale of two real estate properties and
an increase in members from the opening of 12 new clubs. The scal
2013 increase was primarily due to an increase in total members aided
by the opening of nine new clubs.
Sam’s Club did not leverage expenses for scal 2014 as operating
expenses as a percentage of segment net sales increased 26 basis points,
when compared to the previous scal year. The increase in operating
expenses as a percentage of segment net sales was primarily due to a
$59 million charge for the implementation of a new in-club stang
structure and the pending closure of one club, as well as a state excise
tax refund credit we received in the previous scal year. Sam’s Club
leveraged expenses for scal 2013 as operating expenses as a percentage
of segment net sales decreased 9 basis points, when compared to the
previous scal year. The scal 2013 decrease was due to improved wage
management, a state excise tax refund credit we received and lower
expenses in connection with club remodels.
As a result of the factors discussed above, operating income was
$2.0 billion, $2.0 billion and $1.8 billion for scal 2014, 2013 and 2012,
respectively. Sam’s Club did not grow operating income faster than
net sales in scal 2014, but did grow operating income faster than sales
in scal 2013.
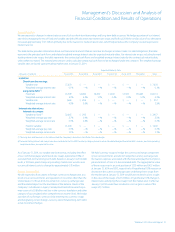
Liquidity and Capital Resources
Liquidity
Cash ows provided by operating activities have historically supplied us
with a signicant source of liquidity. We use these cash ows, supple-
mented with long-term debt and short-term borrowings, to fund our
operations and global expansion activities. Generally, some or all of the
remaining available cash ow funds all or part of the dividends on our
common stock and share repurchases.
Fiscal Years Ended January 31,
(Amounts in millions) 2014 2013 2012
Net cash provided by
operating activities $ 23,257 $ 25,591 $ 24,255
Payments for property
and equipment (13,115) (12,898) (13,510)
Free cash ow $ 10,142 $ 12,693 $ 10,745
Net cash used in
investing activities
(1)
$(12,298) $(12,611) $(16,609)
Net cash used in
nancing activities (11,017) (11,972) (8,458)
(1) “Net cash used in investing activities” includes payments for property and equipment,
which is also included in our computation of free cash flow.
26 Walmart 2014 Annual Report