Walmart 2014 Annual Report Download - page 24
Download and view the complete annual report
Please find page 24 of the 2014 Walmart annual report below. You can navigate through the pages in the report by either clicking on the pages listed below, or by using the keyword search tool below to find specific information within the annual report.-
 1
1 -
2
-
3
-
4
-
5
-
6
-
7
-
8
-
9
-
10
-
11
-
12
-
13
-
 14
14 -
 15
15 -
 16
16 -
 17
17 -
 18
18 -
 19
19 -
 20
20 -
 21
21 -
 22
22 -
 23
23 -
 24
24 -
 25
25 -
 26
26 -
 27
27 -
 28
28 -
 29
29 -
 30
30 -
 31
31 -
 32
32 -
 33
33 -
 34
34 -
35
-
36
-
37
-
38
-
39
-
40
-
41
-
42
-
43
-
44
-
45
-
46
-
47
-
48
-
49
-
50
-
51
-
52
-
53
-
54
-
55
-
56
-
57
-
58
-
59
-
60
-
61
-
62
-
63
-
64
-
65
-
66
-
67
-
68
 |
 |
Management’s Discussion and Analysis of
Financial Condition and Results of Operations
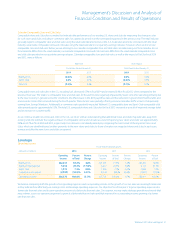
Operating Expenses
For scal 2014, we did not meet our objective of growing operating
expenses at a slower rate than net sales as operating expenses as a
percentage of net sales increased 27 basis points. Overall, lower than
anticipated net sales, higher investment in key areas, such as global
leverage and e-commerce initiatives, and nearly $1.0 billion of increased
expenses for various matters described in the Walmart International seg-
ment discussion, were the primary causes for the increase in operating
expenses as a percentage of net sales. Additional expenses related to the
Foreign Corrupt Practices Act (“FCPA”) inquiries and investigations, as well
as our global compliance program and related organizational enhancements,
also contributed to the increase in operating expenses as a percentage of
net sales. The negative leverage impact of these items was partially oset
by lower incentive expenses for scal 2014. For scal 2013, we met our
objective of growing operating expenses at a slower rate than net sales
as operating expenses as a percentage of net sales decreased 14 basis
points. The scal 2013 decrease in operating expenses as a percentage
of net sales was primarily due to productivity improvements and
expense management.
Expenses incurred for the FCPA inquiries and investigations, as well as our
global compliance program and related organizational enhancements,
were $282 million and $157 million for scal 2014 and 2013, respectively.
Operating Income
For scal 2014, we did not meet our objective of growing operating
income at a faster rate than net sales as operating income decreased
3.1% while net sales increased 1.6%, when compared to the previous
scal year. This was primarily due to the factors we discussed for not
leveraging operating expenses, partially oset by increases in member-
ship and other income of 5.6%. For scal 2013, we also did not meet our
objective of growing operating income at a faster rate than net sales as
operating income increased 4.7% while net sales increased 5.0%, when
compared to the previous scal year. The primary causes for operating
income growing slower than net sales in scal 2013 were our increased
investments in e-commerce initiatives, increased expenses related to
the FCPA inquiries and investigations, as well as our global compliance
program and related organizational enhancements, and investments
in price, which reduced gross margin.
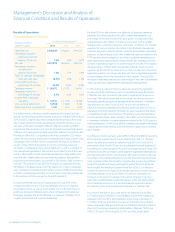
Returns
Return on Investment
Management believes return on investment (“ROI”) is a meaningful
metric to share with investors because it helps investors assess how
eectively Walmart is deploying its assets. Trends in ROI can uctuate
over time as management balances long-term potential strategic
initiatives with possible short-term impacts. ROI was 17.0% and 18.1% for
scal 2014 and 2013, respectively. The decline in ROI was primarily due to
a decline in operating income, investments in property and equipment
and the impact of acquisitions.
ROI is considered a non-GAAP nancial measure. We consider return on
assets (“ROA”) to be the nancial measure computed in accordance with
generally accepted accounting principles (“GAAP”) that is the most
directly comparable nancial measure to our calculation of ROI. ROA was
8.1% and 8.9% for scal 2014 and 2013, respectively.
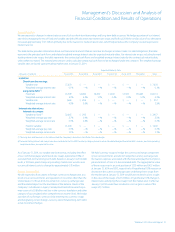
We dene ROI as adjusted operating income (operating income plus
interest income, depreciation and amortization, and rent expense) for
the trailing twelve months or scal year divided by average invested
capital during that period. We consider average invested capital to be
the average of our beginning and ending total assets of continuing
operations, plus average accumulated depreciation and amortization
less average accounts payable and average accrued liabilities for that
period, plus a rent factor equal to the rent for the scal year or trailing
twelve months multiplied by a factor of eight. When we have discontinued
operations, we exclude the impact of the discontinued operations.
Our calculation of ROI is considered a non-GAAP nancial measure
because we calculate ROI using nancial measures that exclude and
include amounts that are included and excluded in the most directly
comparable GAAP nancial measure. For example, we exclude the
impact of depreciation and amortization from our reported operating
income in calculating the numerator of our calculation of ROI. In addi-
tion, we include a factor of eight for rent expense that estimates the
hypothetical capitalization of our operating leases. ROI diers from ROA
(which is consolidated income from continuing operations for the period
divided by average total assets of continuing operations for the period)
because ROI: adjusts operating income to exclude certain expense items
and adds interest income; adjusts total assets of continuing operations
for the impact of accumulated depreciation and amortization, accounts
payable and accrued liabilities; and incorporates a factor of rent to arrive
at total invested capital.
Although ROI is a standard nancial metric, numerous methods exist
for calculating a company’s ROI. As a result, the method used by
management to calculate our ROI may dier from the methods used by
other companies to calculate their ROI. We urge you to understand
the methods used by other companies to calculate their ROI before
comparing our ROI to that of such other companies.
22 Walmart 2014 Annual Report