Walmart 2014 Annual Report Download - page 26
Download and view the complete annual report
Please find page 26 of the 2014 Walmart annual report below. You can navigate through the pages in the report by either clicking on the pages listed below, or by using the keyword search tool below to find specific information within the annual report.-
 1
1 -
2
-
3
-
4
-
5
-
6
-
7
-
8
-
9
-
10
-
11
-
12
-
13
-
14
-
15
-
 16
16 -
 17
17 -
 18
18 -
 19
19 -
 20
20 -
 21
21 -
 22
22 -
 23
23 -
 24
24 -
 25
25 -
 26
26 -
 27
27 -
 28
28 -
 29
29 -
 30
30 -
 31
31 -
 32
32 -
 33
33 -
 34
34 -
 35
35 -
 36
36 -
37
-
38
-
39
-
40
-
41
-
42
-
43
-
44
-
45
-
46
-
47
-
48
-
49
-
50
-
51
-
52
-
53
-
54
-
55
-
56
-
57
-
58
-
59
-
60
-
61
-
62
-
63
-
64
-
65
-
66
-
67
-
68
 |
 |

Management’s Discussion and Analysis of
Financial Condition and Results of Operations
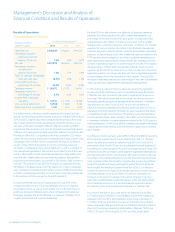
Results of Operations
Consolidated Results of Operations
(Amounts in millions, Fiscal Years Ended January 31,
except unit counts) 2014 2013 2012
Total revenues $476,294 $468,651 $446,509
Percentage change in
total revenues from
previous scal year 1.6% 5.0% 6.0%
Net sales $473,076 $465,604 $443,416
Percentage change in
net sales from
previous scal year 1.6% 5.0% 5.9%
Total U.S. calendar comparable
store and club sales (0.5)% 2.4% 1.6%
Gross prot margin as a
percentage of net sales 24.3% 24.3% 24.5%
Operating income $ 26,872 $ 27,725 $ 26,491
Operating income as a
percentage of net sales 5.7% 6.0% 6.0%
Income from continuing
operations $ 16,551 $ 17,704 $ 16,408
Unit counts at period end 10,942 10,408 9,766
Retail square feet at period end 1,101 1,070 1,035
Our total revenues, which are mostly comprised of net sales, but also
include membership and other income, increased 1.6% and 5.0% for scal
2014 and 2013, respectively, when compared to the previous scal year.
The increase in total revenues was primarily a result of increases in our
net sales, which also increased 1.6% and 5.0% for scal 2014 and 2013,
respectively. The increase in net sales for scal 2014 was primarily due to
3.1% year-over-year growth in retail square feet, higher e-commerce sales,
the impact of scal 2013 acquisitions, which accounted for $730 million
of the net sales increase, and positive comparable club sales at Sam’s Club.
The positive eect of these items was partially oset by $5.1 billion of
negative impact from uctuations in currency exchange rates and
decreases in comparable store sales at Walmart U.S. and in a number of
our international operations. The increase in net sales for scal 2013 was
due to 3.3% growth in retail square feet and positive comparable store
and club sales. Additionally, net sales from acquisitions, through their
respective anniversary dates, accounted for $4.0 billion of the increase in
net sales. The increase in net sales for scal 2013 was partially oset by
$4.5 billion of negative impact from uctuations in currency exchange
rates. Increases in membership and other income of 5.6%, primarily due
to higher membership and other income at Sam’s Club, also contributed
to the increase in total revenues for scal 2014 and 2013.
Our gross prot rate decreased 3 basis points for scal 2014, when
compared to the previous scal year, primarily due to our ongoing
investment in price, as well as merchandise mix. For scal 2013, gross
prot rate decreased 12 basis points, when compared to the previous
scal year, primarily due to the Walmart U.S. segment’s strategic focus
on price investment and low price leadership.
For scal 2014, we did not meet our objective of growing operating
expenses at a slower rate than net sales as operating expenses as a
percentage of net sales increased 27 basis points. Overall, lower than
anticipated net sales, higher investment in key areas, such as global
leverage and e-commerce initiatives, and nearly $1.0 billion of increased
expenses for various matters described in the Walmart International
segment discussion, were the primary cause for the increase in operating
expenses as a percentage of net sales. Additional expenses related to the
FCPA inquiries and investigations, as well as our global compliance pro-
gram and related organizational enhancements also contributed to the
increase in operating expenses as a percentage of net sales. The negative
leverage impact of these items was partially oset by lower incentive
expenses for scal 2014. For scal 2013, we met our objective of growing
operating expenses at a slower rate than net sales as operating expenses
as a percentage of net sales decreased 14 basis points. The scal 2013
decrease in operating expenses as a percentage of net sales was primarily
due to productivity improvements and expense management.
For scal 2014, we did not meet our objective of growing operating
income at a faster rate than net sales as operating income decreased
3.1% while net sales increased 1.6%, when compared to the previous
scal year. This was primarily due to the factors we discussed for not
leveraging operating expenses, partially oset by increases in member-
ship and other income. For scal 2013, we also did not meet our
objective of growing operating income at a faster rate than net sales as
operating income increased 4.7% while net sales increased 5.0%, when
compared to the previous scal year. The primary causes for operating
income growing slower than net sales in scal 2013 were investments in
e-commerce initiatives, increased expenses related to the FCPA inquiries
and investigations, as well as our global compliance program and related
organizational enhancements, and investments in price, which reduced
gross margin.
Our eective income tax rates were 32.9%, 31.0% and 32.6% for scal 2014,
2013 and 2012, respectively. The reconciliation from the U.S. statutory
rate to the eective income tax rates for scal 2014, 2013 and 2012 is
presented in Note 9 in the “Notes to Consolidated Financial Statements.”
Our eective income tax rate for scal 2014 was higher than in scal 2013
primarily due to the tax impacts attributable to repatriated international
earnings during scal 2014. Our scal 2013 eective income tax rate was
lower than in scal 2012 primarily because the scal 2013 rate beneted
from a number of discrete tax items, including the positive impact from
scal 2013 legislative changes arising at the end of the scal 2012 year,
most notably the American Taxpayer Relief Act of 2012. Our eective
income tax rate may uctuate from period to period as a result of factors
including changes in our assessment of certain tax contingencies,
increases or decreases in valuation allowances, changes in tax law,
outcomes of administrative audits, the impact of discrete items and the
mix of earnings among our U.S. and international operations where
the statutory rates are generally lower than the U.S. statutory rate.
As a result of the factors discussed above, we reported $16.6 billion,
$17.7 billion and $16.4 billion of consolidated income from continuing
operations for scal 2014, 2013 and 2012, respectively, a decrease of
$1.1 billion for scal 2014 and an increase of $1.3 billion for scal 2013,
when compared to the previous scal year. Diluted income per common
share from continuing operations attributable to Walmart (“EPS”) was
$4.85, $5.01 and $4.53 for scal 2014, 2013 and 2012, respectively.
24 Walmart 2014 Annual Report