Walmart 2014 Annual Report Download - page 29
Download and view the complete annual report
Please find page 29 of the 2014 Walmart annual report below. You can navigate through the pages in the report by either clicking on the pages listed below, or by using the keyword search tool below to find specific information within the annual report.-
 1
1 -
2
-
3
-
4
-
5
-
6
-
7
-
8
-
9
-
10
-
11
-
12
-
13
-
14
-
15
-
16
-
17
-
18
-
 19
19 -
 20
20 -
 21
21 -
 22
22 -
 23
23 -
 24
24 -
 25
25 -
 26
26 -
 27
27 -
 28
28 -
 29
29 -
 30
30 -
 31
31 -
 32
32 -
 33
33 -
 34
34 -
 35
35 -
 36
36 -
 37
37 -
 38
38 -
 39
39 -
40
-
41
-
42
-
43
-
44
-
45
-
46
-
47
-
48
-
49
-
50
-
51
-
52
-
53
-
54
-
55
-
56
-
57
-
58
-
59
-
60
-
61
-
62
-
63
-
64
-
65
-
66
-
67
-
68
 |
 |

Management’s Discussion and Analysis of
Financial Condition and Results of Operations
Cash Flows Provided by Operating Activities
Cash ows provided by operating activities were $23.3 billion, $25.6 billion
and $24.3 billion for scal 2014, 2013 and 2012, respectively. The decrease
in cash ows provided by operating activities for scal 2014, when
compared to the previous scal year, was primarily due to the timing of
income tax payments, as well as lower income from continuing operations.
The increase in cash ows provided by operating activities in scal 2013,
when compared to the previous scal year, was primarily due to higher
income for continuing operations.
Cash Equivalents and Working Capital
Cash and cash equivalents were $7.3 billion and $7.8 billion at January 31,
2014 and 2013, respectively. Our working capital decits were $8.2 billion
and $11.9 billion at January 31, 2014 and 2013, respectively. The decrease
in our working capital decit was primarily attributable to a decrease in
long-term debt due within one year and an increase in our inventory
levels due to lower than anticipated sales across the Company. Timing
dierences also contributed to the decrease in our working capital
decit. We generally operate with a working capital decit due to our
ecient use of cash in funding operations and in providing returns to
our shareholders in the form of share repurchases and payments of
cash dividends.
We employ nancing strategies (e.g., global funding structures) in an
eort to ensure cash can be made available in the country in which it is
needed with the minimum cost possible. We do not believe it will be
necessary to repatriate cash and cash equivalents held outside of the U.S.
and anticipate our domestic liquidity needs will be met through other
funding sources (ongoing cash ows generated from operations, external
borrowings or both). Accordingly, we intend, with only certain exceptions,
to continue to indenitely reinvest our cash and cash equivalents held
outside of the U.S. in our foreign operations. When the income earned
(either from operations or through global funding structures) and inde-
nitely reinvested outside of the U.S. is taxed at local country tax rates, which
are generally lower than the U.S. statutory rate, we realize an eective tax
rate benet. If our intentions with respect to reinvestment were to change,
most of the amounts held within our foreign operations could be repatri-
ated to the U.S., although any repatriation under current U.S. tax laws
would be subject to U.S. federal income taxes, less applicable foreign tax
credits. As of January 31, 2014 and 2013, cash and cash equivalents of
approximately $1.9 billion may not be freely transferable to the U.S. due
to local laws or other restrictions. We do not expect local laws, other
limitations or potential taxes on anticipated future repatriations of cash
amounts held outside of the U.S. to have a material eect on our overall
liquidity, nancial condition or results of operations.
Cash Flows Used in Investing Activities
Cash ows used in investing activities generally consist of payments
for property and equipment and investments and business acquisitions.
Payments for property and equipment were $13.1 billion, $12.9 billion
and $13.5 billion for scal 2014, 2013 and 2012, respectively. The scal
2014 increase was primarily for additional Neighborhood Markets and
other small formats in the Walmart U.S. segment. The scal 2013 decrease
was primarily the result of lowering the average cost for remodels.
Payments for investments and business acquisitions, net of cash
acquired, were $15 million, $316 million and $3.5 billion for scal 2014,
2013 and 2012, respectively.
Pending Transaction
As discussed in Note 13 to our Consolidated Financial Statements,
we currently anticipate completing the following transaction that will
impact our future cash ows from investing activities:
Vips Restaurant Business in Mexico
In September 2013, Wal-Mart de México, S.A.B. de C.V. (“Walmex”),
a majority-owned subsidiary of the Company, entered into a
denitive agreement with Alsea S.A.B. de C.V. to dispose of Walmex’s
Vips restaurant business (“Vips”) in Mexico for approximately
$625 million. Accordingly, the Vips operating results are presented
as discontinued operations in the Company’s Consolidated
Statements of Income for scal 2014, 2013 and 2012. Additionally,
the Vips assets and liabilities to be disposed of are reported
separately in the Company’s Consolidated Balance Sheets as of
January 31, 2014. The Vips sale is subject to approval by Mexican
regulatory authorities and is currently expected to close during
the rst half of scal 2015. Upon completion of this transaction,
the Company expects to record a net gain, which will be recorded
in discontinued operations in the Company’s Consolidated
Statements of Income.
Global Expansion Activities
In addition to our growth in retail square feet discussed throughout the
“Results of Operations” discussion, we expanded in e-commerce in each of
our segments during scal 2014, with Walmart U.S. and Sam’s Club focused
on the e-commerce market in the U.S. and Walmart International focused
on the e-commerce markets in countries outside of the U.S., primarily the
United Kingdom, China and Brazil. Some of our scal 2014 e-commerce
accomplishments included developing a new recommendation engine
to further personalize search, improving the mobile shopping experience,
accelerating the deployment of our global technology platform and
increasing assortment oered on our websites. Each of these accom-
plishments further supports the operations of our segments.
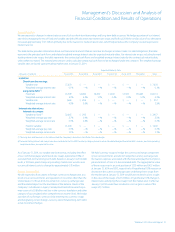
Our scal 2015 global expansion plans include continuing to grow our
retail square feet, which will include a signicant increase in the number
of Neighborhood Markets and other small stores. In addition, we plan to
continue to expand our e-commerce capabilities. We anticipate nancing
our global expansion activities through cash ows provided by operating
activities and future debt nancings. The following table provides our
estimated range for scal 2015 capital expenditures, as well as our
estimated range for growth in retail square feet. Our anticipated
e-commerce capital expenditures are included in our estimated range
for scal 2015 capital expenditures. The amounts in the table do not
include capital expenditures or growth in retail square feet from any
pending or future acquisitions.
Fiscal 2015 Fiscal 2015
Projected Capital Projected Growth in
Expenditures Retail Square Feet
(in billions) (in thousands)
Walmart U.S. $ 6.4 to $ 6.9 21,000 to 23,000
Walmart International 4.0 to 4.5 12,000 to 14,000
Sam’s Club 1.0 to 1.0 2,000 to 2,000
Corporate and support 1.0 to 1.0 — to —
Total $12.4 to $13.4 35,000 to 39,000
Walmart 2014 Annual Report 27