Yahoo 2010 Annual Report Download - page 74
Download and view the complete annual report
Please find page 74 of the 2010 Yahoo annual report below. You can navigate through the pages in the report by either clicking on the pages listed below, or by using the keyword search tool below to find specific information within the annual report.-
 1
1 -
2
-
3
-
4
-
5
-
6
-
7
-
8
-
9
-
10
-
11
-
12
-
13
-
14
-
15
-
16
-
17
-
18
-
19
-
20
-
21
-
22
-
23
-
24
-
25
-
26
-
27
-
28
-
29
-
30
-
31
-
32
-
33
-
34
-
35
-
36
-
37
-
38
-
39
-
40
-
41
-
42
-
43
-
44
-
45
-
46
-
47
-
48
-
49
-
50
-
51
-
52
-
53
-
54
-
55
-
56
-
57
-
58
-
59
-
60
-
61
-
62
-
63
-
 64
64 -
 65
65 -
 66
66 -
 67
67 -
 68
68 -
 69
69 -
 70
70 -
 71
71 -
 72
72 -
 73
73 -
 74
74 -
 75
75 -
 76
76 -
 77
77 -
 78
78 -
 79
79 -
 80
80 -
 81
81 -
 82
82 -
 83
83 -
 84
84 -
85
-
86
-
87
-
88
-
89
-
90
-
91
-
92
-
93
-
94
-
95
-
96
-
97
-
98
-
99
-
100
-
101
-
102
-
103
-
104
-
105
-
106
-
107
-
108
-
109
-
110
-
111
-
112
-
113
-
114
-
115
-
116
-
117
-
118
-
119
-
120
-
121
-
122
-
123
-
124
-
125
-
126
-
127
-
128
 |
 |

common shares issuable upon the exercise of stock options, and shares to be purchased under the 1996 Employee
Stock Purchase Plan, as amended and restated in June 2009 (the “Employee Stock Purchase Plan”). The
Company calculates potential tax windfalls and shortfalls by including the impact of pro forma deferred tax
assets.
The Company takes into account the effect on consolidated net income per share of dilutive securities of entities
in which the Company holds equity interests that are accounted for using the equity method.
For 2008, 2009, and 2010, potentially dilutive securities representing approximately 140 million, 122 million,
and 80 million shares of common stock, respectively, were excluded from the computation of diluted earnings
per share for these periods because their effect would have been anti-dilutive.
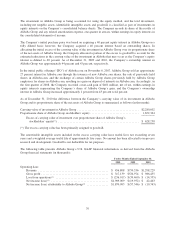
The following table sets forth the computation of basic and diluted net income per share (in thousands, except per
share amounts):
Years Ended December 31,
2008 2009 2010
Basic:
Numerator:
Net income attributable to Yahoo! Inc. ........................ $ 418,921 $ 597,992 $1,231,663
Less: Net income allocated to participating securities ......... (435) (552) (178)
Net income attributable to Yahoo! Inc. common
stockholders—basic ..................................... $ 418,486 $ 597,440 $1,231,485
Denominator:
Weighted average common shares ............................ 1,369,476 1,397,652 1,354,118
Net income attributable to Yahoo! Inc. common stockholders per
share—basic ........................................... $ 0.31 $ 0.43 $ 0.91
Diluted:
Numerator:
Net income attributable to Yahoo! Inc. ........................ $ 418,921 $ 597,992 $1,231,663
Less: Net income allocated to participating securities ......... (265) (54) (94)
Less: Effect of dilutive securities issued by equity investees . . . (11,501) (343) (2,928)
Net income attributable to Yahoo! Inc. common stockholders—diluted . . . $ 407,155 $ 597,595 $1,228,641
Denominator:
Denominator for basic calculation ............................ 1,369,476 1,397,652 1,354,118
Weighted average effect of Yahoo! Inc. dilutive securities:
Restricted stock and restricted stock units .................. 5,240 10,371 5,169
Stock options and employee stock purchase plan ............ 16,514 7,635 5,325
Denominator for diluted calculation ........................... 1,391,230 1,415,658 1,364,612
Net income attributable to Yahoo! Inc. common stockholders per
share—diluted .......................................... $ 0.29 $ 0.42 $ 0.90
72