Yahoo 2010 Annual Report Download - page 79
Download and view the complete annual report
Please find page 79 of the 2010 Yahoo annual report below. You can navigate through the pages in the report by either clicking on the pages listed below, or by using the keyword search tool below to find specific information within the annual report.-
 1
1 -
2
-
3
-
4
-
5
-
6
-
7
-
8
-
9
-
10
-
11
-
12
-
13
-
14
-
15
-
16
-
17
-
18
-
19
-
20
-
21
-
22
-
23
-
24
-
25
-
26
-
27
-
28
-
29
-
30
-
31
-
32
-
33
-
34
-
35
-
36
-
37
-
38
-
39
-
40
-
41
-
42
-
43
-
44
-
45
-
46
-
47
-
48
-
49
-
50
-
51
-
52
-
53
-
54
-
55
-
56
-
57
-
58
-
59
-
60
-
61
-
62
-
63
-
64
-
65
-
66
-
67
-
68
-
 69
69 -
 70
70 -
 71
71 -
 72
72 -
 73
73 -
 74
74 -
 75
75 -
 76
76 -
 77
77 -
 78
78 -
 79
79 -
 80
80 -
 81
81 -
 82
82 -
 83
83 -
 84
84 -
 85
85 -
 86
86 -
 87
87 -
 88
88 -
 89
89 -
90
-
91
-
92
-
93
-
94
-
95
-
96
-
97
-
98
-
99
-
100
-
101
-
102
-
103
-
104
-
105
-
106
-
107
-
108
-
109
-
110
-
111
-
112
-
113
-
114
-
115
-
116
-
117
-
118
-
119
-
120
-
121
-
122
-
123
-
124
-
125
-
126
-
127
-
128
 |
 |

September 30,
2009
September 30,
2010
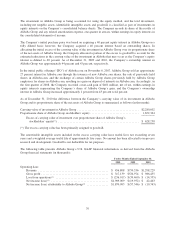
Balance sheet data:
Current assets .................................................... $3,191,097 $4,399,571
Long-term assets ................................................. $2,308,099 $2,436,976
Current liabilities ................................................. $1,559,974 $2,660,043
Long-term liabilities ............................................... $ 24,082 $ 58,679
Non-voting participating redeemable securities ......................... $ 1,733 $ 860
Noncontrolling interests ............................................ $ 223,783 $ 338,419
(1) The loss from operations of $236 million and $14 million for the years ended September 30, 2008 and 2010,
respectively, are primarily due to Alibaba Group’s impairment loss on goodwill and intangible assets for
which the Company has no basis in its investment balance.
(2) The net income of $1.9 billion for the twelve months ended September 30, 2008 is primarily due to Alibaba
Group’s sale of an approximate 27 percent ownership in Alibaba.com from Alibaba.com’s IPO.
Since acquiring its interest in Alibaba Group, the Company has recorded, in retained earnings, cumulative
earnings in equity interests of $308 million and $350 million, respectively as of December 31, 2009 and 2010.
The Company also has commercial arrangements with Alibaba Group to provide technical, development, and
advertising services. For the years ended December 31, 2009 and 2010, these transactions were not material.
Equity Investment in Alibaba.com Limited. As part of the IPO of Alibaba.com, the Company purchased an
approximate 1 percent interest in the common stock of Alibaba.com. This investment was accounted for using
the equity method, consistent with the Company’s investment in Alibaba Group, which holds the controlling
interest in Alibaba.com. In September 2009, the Company sold its direct investment in Alibaba.com for net
proceeds of $145 million and recorded a pre-tax gain of $98 million in other income, net.
Equity Investment in Yahoo Japan. During April 1996, the Company signed a joint venture agreement with
SOFTBANK, which was amended in September 1997, whereby Yahoo Japan Corporation (“Yahoo Japan”) was
formed. Yahoo Japan was formed to establish and manage a local version of Yahoo! in Japan.
Differences between U.S. GAAP and accounting principles generally accepted in Japan (“Japanese GAAP”), the
standards by which Yahoo Japan’s financial statements are prepared, did not materially impact the amounts
reflected in the Company’s consolidated financial statements. The Company makes adjustments to the earnings
in equity interests line in the consolidated statements of income for any differences between U.S. GAAP and
Japanese GAAP.
The fair value of the Company’s approximate 35 percent ownership in the common stock of Yahoo Japan, based
on the quoted stock price, was approximately $8 billion as of December 31, 2010.
The investment in Yahoo Japan is being accounted for using the equity method and the total investment,
including net tangible assets, identifiable intangible assets and goodwill, is classified as part of the investments in
equity interests balance on the Company’s consolidated balance sheets. The Company records its share of the
results of Yahoo Japan and any related amortization expense, one quarter in arrears, within earnings in equity
interests in the consolidated statements of income.
As of December 31, 2009 and 2010, the Company’s ownership interest in Yahoo Japan was approximately 35
percent. Prior to and during 2001, Yahoo Japan acquired the Company’s equity interests in certain entities in
Japan for total consideration of approximately $65 million, paid partially in shares of Yahoo Japan common
stock and partially in cash. As a result of the acquisition, the Company increased its investment in Yahoo Japan,
which resulted in approximately $41 million of goodwill. The carrying value of the Company’s investment in
Yahoo Japan differs from the amount of the underlying equity in net assets of Yahoo Japan primarily as a result
of the goodwill resulting from these transactions. Goodwill is not deductible for tax purposes.
77