Best Buy 2013 Annual Report Download - page 101
Download and view the complete annual report
Please find page 101 of the 2013 Best Buy annual report below. You can navigate through the pages in the report by either clicking on the pages listed below, or by using the keyword search tool below to find specific information within the annual report.-
 1
1 -
2
-
3
-
4
-
5
-
6
-
7
-
8
-
9
-
10
-
11
-
12
-
13
-
14
-
15
-
16
-
17
-
18
-
19
-
20
-
21
-
22
-
23
-
24
-
25
-
26
-
27
-
28
-
29
-
30
-
31
-
32
-
33
-
34
-
35
-
36
-
37
-
38
-
39
-
40
-
41
-
42
-
43
-
44
-
45
-
46
-
47
-
48
-
49
-
50
-
51
-
52
-
53
-
54
-
55
-
56
-
57
-
58
-
59
-
60
-
61
-
62
-
63
-
64
-
65
-
66
-
67
-
68
-
69
-
70
-
71
-
72
-
73
-
74
-
75
-
76
-
77
-
78
-
79
-
80
-
81
-
82
-
83
-
84
-
85
-
86
-
87
-
88
-
89
-
90
-
 91
91 -
 92
92 -
 93
93 -
 94
94 -
 95
95 -
 96
96 -
 97
97 -
 98
98 -
 99
99 -
 100
100 -
 101
101 -
 102
102 -
 103
103 -
 104
104 -
 105
105 -
 106
106 -
 107
107 -
 108
108 -
 109
109 -
 110
110 -
 111
111 -
112
-
113
-
114
-
115
-
116
 |
 |

101
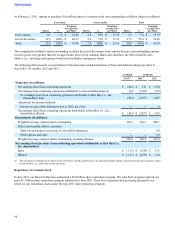
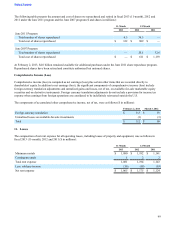
Earnings (loss) from continuing operations before income tax expense and equity in income (loss) of affiliates by jurisdiction
was as follows in fiscal 2013 (11-month), 2012 and 2011 ($ in millions):
11-Month 12-Month
2013 2012 2011
United States $ 281 $ 1,537 $ 1,739
Outside the United States (467)(494) 592
Earnings (loss) from continuing operations before income tax expense and equity in
income (loss) of affiliates $(186) $ 1,043 $ 2,331
Income tax expense was comprised of the following in fiscal 2013 (11-month), 2012 and 2011 ($ in millions):
11-Month 12-Month
2013 2012 2011
Current:
Federal $ 174 $ 447 $ 735
State (3) 61 73
Foreign 79 173 105
250 681 913
Deferred:
Federal 27 94 (113)
State (2) 1 (2)
Foreign (44)(67)(19)
(19) 28 (134)
Income tax expense $ 231 $ 709 $ 779
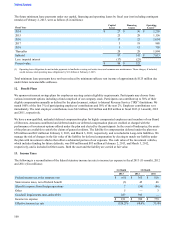
Deferred taxes are the result of differences between the bases of assets and liabilities for financial reporting and income tax
purposes. Deferred tax assets and liabilities were comprised of the following ($ in millions):
February 2, 2013 March 3, 2012
Accrued property expenses $ 194 $ 146
Other accrued expenses 119 108
Deferred revenue 153 128
Compensation and benefits 95 103
Stock-based compensation 137 157
Loss and credit carryforwards 266 310
Other 125 121
Total deferred tax assets 1,089 1,073
Valuation allowance (228)(204)
Total deferred tax assets after valuation allowance 861 869
Property and equipment (343)(376)
Goodwill and intangibles (127)(118)
Inventory (90)(85)
Other (22)(27)
Total deferred tax liabilities (582)(606)
Net deferred tax assets $ 279 $ 263
Table of Contents