Best Buy 2013 Annual Report Download - page 39
Download and view the complete annual report
Please find page 39 of the 2013 Best Buy annual report below. You can navigate through the pages in the report by either clicking on the pages listed below, or by using the keyword search tool below to find specific information within the annual report.-
 1
1 -
2
-
3
-
4
-
5
-
6
-
7
-
8
-
9
-
10
-
11
-
12
-
13
-
14
-
15
-
16
-
17
-
18
-
19
-
20
-
21
-
22
-
23
-
24
-
25
-
26
-
27
-
28
-
 29
29 -
 30
30 -
 31
31 -
 32
32 -
 33
33 -
 34
34 -
 35
35 -
 36
36 -
 37
37 -
 38
38 -
 39
39 -
 40
40 -
 41
41 -
 42
42 -
 43
43 -
 44
44 -
 45
45 -
 46
46 -
 47
47 -
 48
48 -
 49
49 -
50
-
51
-
52
-
53
-
54
-
55
-
56
-
57
-
58
-
59
-
60
-
61
-
62
-
63
-
64
-
65
-
66
-
67
-
68
-
69
-
70
-
71
-
72
-
73
-
74
-
75
-
76
-
77
-
78
-
79
-
80
-
81
-
82
-
83
-
84
-
85
-
86
-
87
-
88
-
89
-
90
-
91
-
92
-
93
-
94
-
95
-
96
-
97
-
98
-
99
-
100
-
101
-
102
-
103
-
104
-
105
-
106
-
107
-
108
-
109
-
110
-
111
-
112
-
113
-
114
-
115
-
116
 |
 |

39
• increased promotional activity, notably in televisions, movies and gaming;
• an increased sales mix of promotional items;
• a shift from one-time computer repair services to ongoing support contracts; and
• an increased sales mix of lower-margin mobile computing products;
• partially offset by increased sales of higher-margin service products for mobile phones.
Our Domestic segment's SG&A grew $78 million, or 1.1%, in fiscal 2012 compared to fiscal 2011. The increase in SG&A was
driven by an extra week of operations in fiscal 2012, which had 53 weeks compared to 52 weeks in fiscal 2011. Excluding the
impact of the extra week, our Domestic segment's SG&A declined, as increased costs driven by the opening of new stores and
increased advertising were more than offset by decreases in compensation costs, a decrease in the Best Buy Mobile profit
share-based management fee due to strategic changes at Best Buy Europe and reduced spending on third-party services. The
Domestic segment's SG&A rate remained relatively flat in fiscal 2012 compared to fiscal 2011. For further information on the
strategic changes at Best Buy Europe, see Additional Consolidated Results, below.
Our Domestic segment recorded $43 million of restructuring charges in fiscal 2012, which included $19 million of inventory
write-downs included in cost of goods sold. The restructuring charges consisted of property and equipment impairments related
to changes in our mobile broadband offerings, as well as inventory write-downs and facility closure costs related primarily to
activities we undertook to improve supply chain and operational efficiencies in our Domestic segment. These restructuring
charges resulted in a decrease in our operating income in fiscal 2012 of 0.1% of revenue. Our Domestic segment recorded
restructuring charges of $40 million, including $9 million of inventory write-downs included in cost of goods sold, in fiscal
2011. The restructuring charges resulted from activities to improve supply chain and operational efficiencies and included
charges for employee termination benefits, property and equipment impairments and inventory write-downs.
The $199 million decrease in our Domestic segment's operating income for fiscal 2012 was principally the result of a decrease
in gross profit due to a decline in the gross profit rate and higher SG&A spending, partially offset by an increase in revenue.
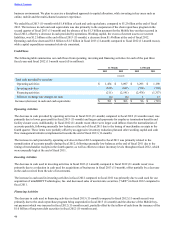
International
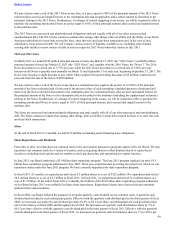
The following table presents selected financial data for our International segment for each of the past three fiscal years and
fiscal 2012 (11-month recast) ($ in millions):
11-Month 12-Month
International Segment Performance Summary 2013 2012 2012 2011
(recast)
Revenue $ 11,742 $ 11,954 $ 13,090 $ 12,677
Revenue gain (decline) % (1.8)% n/a 3.3 % 4.7%
Comparable store sales % gain (decline) (6.9)% (2.5)% (2.1)% 2.3%
Gross profit $ 2,812 $ 3,121 $ 3,387 $ 3,227
Gross profit as a % of revenue 23.9 % 26.1 % 25.9 % 25.5%
SG&A $ 2,729 $ 2,683 $ 2,935 $ 2,800
SG&A as a % of revenue 23.2 % 22.4 % 22.4 % 22.1%
Restructuring charges $ 123 $ 15 $ 15 $ 107
Goodwill impairments $ 819 $ 1,207 $ 1,207 $ —
Operating income (loss) $ (859) $ (784) $ (770) $ 320
Operating income (loss) as a % of revenue (7.3)% (6.6)% (5.9)% 2.5%
Table of Contents