Best Buy 2013 Annual Report Download - page 98
Download and view the complete annual report
Please find page 98 of the 2013 Best Buy annual report below. You can navigate through the pages in the report by either clicking on the pages listed below, or by using the keyword search tool below to find specific information within the annual report.-
 1
1 -
2
-
3
-
4
-
5
-
6
-
7
-
8
-
9
-
10
-
11
-
12
-
13
-
14
-
15
-
16
-
17
-
18
-
19
-
20
-
21
-
22
-
23
-
24
-
25
-
26
-
27
-
28
-
29
-
30
-
31
-
32
-
33
-
34
-
35
-
36
-
37
-
38
-
39
-
40
-
41
-
42
-
43
-
44
-
45
-
46
-
47
-
48
-
49
-
50
-
51
-
52
-
53
-
54
-
55
-
56
-
57
-
58
-
59
-
60
-
61
-
62
-
63
-
64
-
65
-
66
-
67
-
68
-
69
-
70
-
71
-
72
-
73
-
74
-
75
-
76
-
77
-
78
-
79
-
80
-
81
-
82
-
83
-
84
-
85
-
86
-
87
-
 88
88 -
 89
89 -
 90
90 -
 91
91 -
 92
92 -
 93
93 -
 94
94 -
 95
95 -
 96
96 -
 97
97 -
 98
98 -
 99
99 -
 100
100 -
 101
101 -
 102
102 -
 103
103 -
 104
104 -
 105
105 -
 106
106 -
 107
107 -
 108
108 -
109
-
110
-
111
-
112
-
113
-
114
-
115
-
116
 |
 |

98
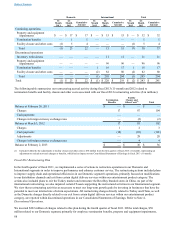
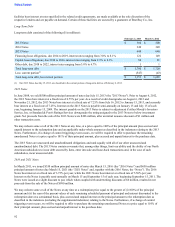
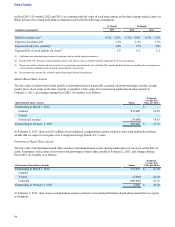
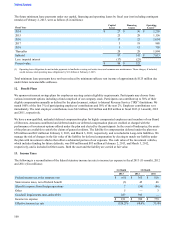
At February 2, 2013, options to purchase 30.0 million shares of common stock were outstanding as follows (shares in millions):
Exercisable Unexercisable Total
Shares %
Weighted-
Average Price
per Share Shares %
Weighted-
Average Price
per Share Shares %
Weighted-
Average Price
per Share
In-the-money 0.1 —% $ 18.02 2.0 27% $ 15.78 2.1 7% $ 15.97
Out-of-the-money 22.5 100% $ 40.15 5.4 73% $ 31.55 27.9 93% $ 38.46
Total 22.6 100% $ 39.98 7.4 100% $ 27.55 30.0 100% $ 36.93
The computation of dilutive shares outstanding excludes the out-of-the-money stock options because such outstanding options'
exercise prices were greater than the average market price of our common shares and, therefore, the effect would be anti-
dilutive (i.e., including such options would result in higher earnings per share).
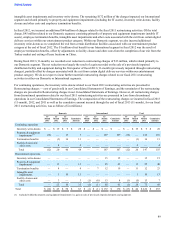
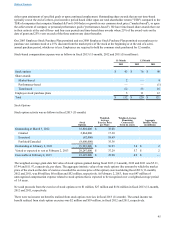
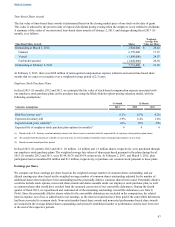
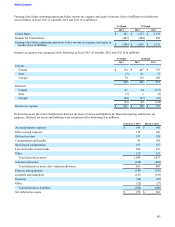
The following table presents a reconciliation of the numerators and denominators of basic and diluted earnings per share in
fiscal 2013 (11-month), 2012 and 2011:
11-Month 12-Month
2013(1) 2012(1) 2011
Numerator (in millions):
Net earnings (loss) from continuing operations $ (421) $ 330 $ 1,554
Net earnings from continuing operations attributable to noncontrolling interests (22)(1,387)(127)
Net earnings (loss) from continuing operations attributable to Best Buy Co., Inc.,
shareholders, basic (443)(1,057) 1,427
Adjustment for assumed dilution:
Interest on convertible debentures due in 2022, net of tax — — 6
Net earnings (loss) from continuing operations attributable to Best Buy Co., Inc.,
shareholders, diluted $(443) $ (1,057) $ 1,433
Denominator (in millions):
Weighted-average common shares outstanding 338.6 366.3 406.1
Effect of potentially dilutive securities:
Shares from assumed conversion of convertible debentures — — 8.8
Stock options and other — — 1.6
Weighted-average common shares outstanding, assuming dilution 338.6 366.3 416.5
Net earnings (loss) per share from continuing operations attributable to Best Buy Co.,
Inc. shareholders
Basic $ (1.31) $ (2.89) $ 3.51
Diluted $ (1.31) $ (2.89) $ 3.44
(1) The calculation of diluted loss per share for fiscal 2013 (11-month) and 2012 does not include potentially dilutive securities because their inclusion would
be anti-dilutive (i.e., reduce the net loss per share).
Repurchase of Common Stock
In June 2011, our Board of Directors authorized a $5.0 billion share repurchase program. The June 2011 program replaced our
prior $5.5 billion share repurchase program authorized in June 2007. There is no expiration date governing the period over
which we can repurchase shares under the June 2011 share repurchase program.
Table of Contents