Best Buy 2013 Annual Report Download - page 56
Download and view the complete annual report
Please find page 56 of the 2013 Best Buy annual report below. You can navigate through the pages in the report by either clicking on the pages listed below, or by using the keyword search tool below to find specific information within the annual report.-
 1
1 -
2
-
3
-
4
-
5
-
6
-
7
-
8
-
9
-
10
-
11
-
12
-
13
-
14
-
15
-
16
-
17
-
18
-
19
-
20
-
21
-
22
-
23
-
24
-
25
-
26
-
27
-
28
-
29
-
30
-
31
-
32
-
33
-
34
-
35
-
36
-
37
-
38
-
39
-
40
-
41
-
42
-
43
-
44
-
45
-
 46
46 -
 47
47 -
 48
48 -
 49
49 -
 50
50 -
 51
51 -
 52
52 -
 53
53 -
 54
54 -
 55
55 -
 56
56 -
 57
57 -
 58
58 -
 59
59 -
 60
60 -
 61
61 -
 62
62 -
 63
63 -
 64
64 -
 65
65 -
 66
66 -
67
-
68
-
69
-
70
-
71
-
72
-
73
-
74
-
75
-
76
-
77
-
78
-
79
-
80
-
81
-
82
-
83
-
84
-
85
-
86
-
87
-
88
-
89
-
90
-
91
-
92
-
93
-
94
-
95
-
96
-
97
-
98
-
99
-
100
-
101
-
102
-
103
-
104
-
105
-
106
-
107
-
108
-
109
-
110
-
111
-
112
-
113
-
114
-
115
-
116
 |
 |

56
Self-Insured Liabilities
We are self-insured for certain losses related to health, workers' compensation and general liability claims, as well as customer
warranty and insurance programs, although we obtain third party insurance coverage to limit our exposure to these claims.
When estimating our self-insured liabilities, we consider a number of factors, including historical claims experience,
demographic factors, severity factors and valuations provided by independent third-party actuaries. Our self-insured liabilities
involve uncertainty because management is required to make assumptions and to apply judgment to estimate the ultimate cost
to settle reported claims and claims incurred but not reported at the balance sheet date.
We do not believe there is a reasonable likelihood that there will be a material change in the estimates or assumptions we use to
calculate our self-insured liabilities. However, if actual results are not consistent with our estimates or assumptions, we may be
exposed to losses or gains that could be material. A 10% change in our self-insured liabilities at February 2, 2013, would have
affected net earnings by approximately $8 million in fiscal 2013 (11-month).
New Accounting Standards
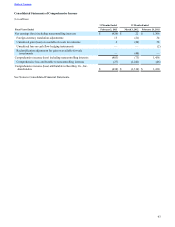
Comprehensive Income — In June 2011, the FASB issued new guidance on the presentation of comprehensive income.
Specifically, the new guidance requires an entity to present components of net income and other comprehensive income in one
continuous statement, referred to as the statement of comprehensive income, or in two separate but consecutive statements. The
new guidance eliminated the previous option to report other comprehensive income and its components in the statement of
changes in equity. While the new guidance changed the presentation of comprehensive income, there are no changes to the
components that are recognized in net income or other comprehensive income under current accounting guidance. This new
guidance is effective for fiscal years and interim periods beginning after December 15, 2011. Accordingly, we adopted the new
guidance on March 4, 2012, and have presented total comprehensive income in our Consolidated Statements of Comprehensive
Income.
Item 7A. Quantitative and Qualitative Disclosures About Market Risk.
In addition to the risks inherent in our operations, we are exposed to certain market risks, including adverse changes in foreign
currency exchange rates and interest rates.
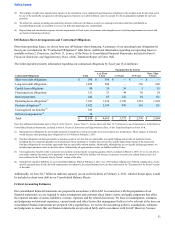
Foreign Currency Exchange Rate Risk
We have market risk arising from changes in foreign currency exchange rates related to our International segment operations.
On a limited basis, we use forward foreign exchange contracts to hedge the impact of fluctuations in foreign currency exchange
rates. Our Canada, Europe and China businesses enter into the contracts primarily to hedge certain non-functional currency
transaction exposures and not for speculative purposes.
The aggregate notional amount related to our foreign exchange forward contracts outstanding at February 2, 2013, and
March 3, 2012, was $173 million and $238 million, respectively. The fair value recorded on our Consolidated Balance Sheet
related to our foreign exchange forward contracts outstanding at February 2, 2013, and March 3, 2012, was $1 million and
$(1) million, respectively. The amount recorded in our Consolidated Statement of Earnings related to all contracts settled and
outstanding was a gain of $1 million in fiscal 2013 (11-month), and a gain of $11 million in fiscal 2012.
The overall weakness of the U.S. dollar compared to the Chinese Renminbi and the weakness of the Euro to the U.K. pound
since the end of fiscal 2012 has had a positive overall impact on our revenue, which was partially offset by the strength of the
U.S. dollar compared to the U.K. pound, Canadian dollar, and Mexican peso. It is not possible to determine the exact impact of
foreign currency exchange rate fluctuations; however, the effect on reported revenue and net earnings can be estimated. We
estimate that foreign currency exchange rate fluctuations had a net favorable impact on our revenue in fiscal 2013 (11-month)
of approximately $121 million and a net unfavorable impact on earnings of $17 million. Similarly, we estimate that the overall
weakness of the U.S. dollar had a favorable impact on our revenue and net earnings in fiscal 2012 of approximately $456
million and $2 million, respectively.
Table of Contents