Best Buy 2013 Annual Report Download - page 80
Download and view the complete annual report
Please find page 80 of the 2013 Best Buy annual report below. You can navigate through the pages in the report by either clicking on the pages listed below, or by using the keyword search tool below to find specific information within the annual report.-
 1
1 -
2
-
3
-
4
-
5
-
6
-
7
-
8
-
9
-
10
-
11
-
12
-
13
-
14
-
15
-
16
-
17
-
18
-
19
-
20
-
21
-
22
-
23
-
24
-
25
-
26
-
27
-
28
-
29
-
30
-
31
-
32
-
33
-
34
-
35
-
36
-
37
-
38
-
39
-
40
-
41
-
42
-
43
-
44
-
45
-
46
-
47
-
48
-
49
-
50
-
51
-
52
-
53
-
54
-
55
-
56
-
57
-
58
-
59
-
60
-
61
-
62
-
63
-
64
-
65
-
66
-
67
-
68
-
69
-
 70
70 -
 71
71 -
 72
72 -
 73
73 -
 74
74 -
 75
75 -
 76
76 -
 77
77 -
 78
78 -
 79
79 -
 80
80 -
 81
81 -
 82
82 -
 83
83 -
 84
84 -
 85
85 -
 86
86 -
 87
87 -
 88
88 -
 89
89 -
 90
90 -
91
-
92
-
93
-
94
-
95
-
96
-
97
-
98
-
99
-
100
-
101
-
102
-
103
-
104
-
105
-
106
-
107
-
108
-
109
-
110
-
111
-
112
-
113
-
114
-
115
-
116
 |
 |

80
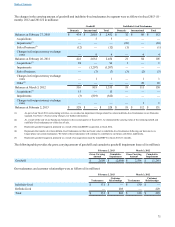
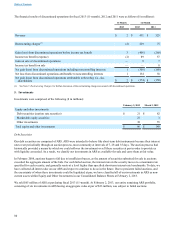
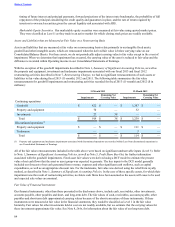
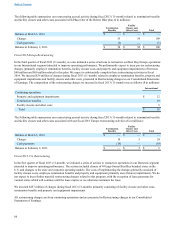
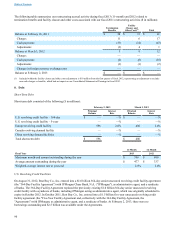
The financial results of discontinued operations for fiscal 2013 (11-month), 2012 and 2011 were as follows ($ in millions):
11-Month 12-Month
2013 2012 2011
Revenue $ 2 $ 411 $ 525
Restructuring charges(1) (2) 229 75
Gain (loss) from discontinued operations before income tax benefit 3 (406)(260)
Income tax benefit (expense) (2) 89 57
Gain on sale of discontinued operations — 9 7
Income tax benefit on sale — — 8
Net gain (loss) from discontinued operations including noncontrolling interests 1 (308)(188)
Net loss from discontinued operations attributable to noncontrolling interests 1 134 38
Net gain (loss) from discontinued operations attributable to Best Buy Co., Inc.
shareholders $ 2 $ (174) $ (150)
(1) See Note 7, Restructuring Charges, for further discussion of the restructuring charges associated with discontinued operations.
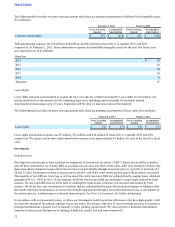
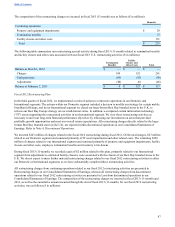
5. Investments
Investments were comprised of the following ($ in millions):
February 2, 2013 March 3, 2012
Equity and other investments
Debt securities (auction rate securities) $ 21 $ 82
Marketable equity securities 27 3
Other investments 38 55
Total equity and other investments $ 86 $ 140
Debt Securities
Our debt securities are comprised of ARS. ARS were intended to behave like short-term debt instruments because their interest
rates reset periodically through an auction process, most commonly at intervals of 7, 28 and 35 days. The auction process had
historically provided a means by which we could rollover the investment or sell these securities at par in order to provide us
with liquidity as needed. As a result, we classify our investments in ARS as available-for-sale and carry them at fair value.
In February 2008, auctions began to fail due to insufficient buyers, as the amount of securities submitted for sale in auctions
exceeded the aggregate amount of the bids. For each failed auction, the interest rate on the security moves to a maximum rate
specified for each security, and generally resets at a level higher than specified short-term interest rate benchmarks. To date, we
have collected all interest due on our ARS and expect to continue to do so in the future. Due to persistent failed auctions, and
the uncertainty of when these investments could be liquidated at par, we have classified all of our investments in ARS as non-
current assets within Equity and Other Investments in our Consolidated Balance Sheets at February 2, 2013.
We sold $65 million of ARS at par during fiscal 2013 (11-month). At February 2, 2013, our entire remaining ARS portfolio,
consisting of six investments in ARS having an aggregate value at par of $23 million, was subject to failed auctions.
Table of Contents