Best Buy 2013 Annual Report Download - page 67
Download and view the complete annual report
Please find page 67 of the 2013 Best Buy annual report below. You can navigate through the pages in the report by either clicking on the pages listed below, or by using the keyword search tool below to find specific information within the annual report.-
 1
1 -
2
-
3
-
4
-
5
-
6
-
7
-
8
-
9
-
10
-
11
-
12
-
13
-
14
-
15
-
16
-
17
-
18
-
19
-
20
-
21
-
22
-
23
-
24
-
25
-
26
-
27
-
28
-
29
-
30
-
31
-
32
-
33
-
34
-
35
-
36
-
37
-
38
-
39
-
40
-
41
-
42
-
43
-
44
-
45
-
46
-
47
-
48
-
49
-
50
-
51
-
52
-
53
-
54
-
55
-
56
-
 57
57 -
 58
58 -
 59
59 -
 60
60 -
 61
61 -
 62
62 -
 63
63 -
 64
64 -
 65
65 -
 66
66 -
 67
67 -
 68
68 -
 69
69 -
 70
70 -
 71
71 -
 72
72 -
 73
73 -
 74
74 -
 75
75 -
 76
76 -
 77
77 -
78
-
79
-
80
-
81
-
82
-
83
-
84
-
85
-
86
-
87
-
88
-
89
-
90
-
91
-
92
-
93
-
94
-
95
-
96
-
97
-
98
-
99
-
100
-
101
-
102
-
103
-
104
-
105
-
106
-
107
-
108
-
109
-
110
-
111
-
112
-
113
-
114
-
115
-
116
 |
 |

67
Use of Estimates in the Preparation of Financial Statements
The preparation of financial statements in conformity with accounting principles generally accepted in the U.S. ("GAAP")
requires us to make estimates and assumptions. These estimates and assumptions affect the reported amounts in the
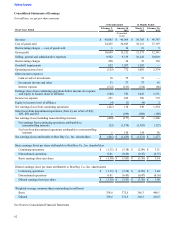
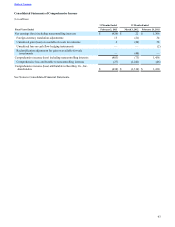
Consolidated Balance Sheets and Consolidated Statements of Earnings and Comprehensive Income, as well as the disclosure of
contingent liabilities. Future results could be materially affected if actual results were to differ from these estimates and
assumptions.
Cash and Cash Equivalents
Cash primarily consists of cash on hand and bank deposits. Cash equivalents consist of money market funds, U.S. Treasury
bills, commercial paper and time deposits such as certificates of deposit with an original maturity of three months or less when
purchased. The amounts of cash equivalents at February 2, 2013, and March 3, 2012, were $740 million and $343 million,
respectively, and the weighted-average interest rates were 0.3% and 0.1%, respectively.
Outstanding checks in excess of funds on deposit (book overdrafts) totaled $97 million and $80 million at February 2, 2013,
and March 3, 2012, respectively, and are reflected within Accounts payable in our Consolidated Balance Sheets.
Receivables
Receivables consist principally of amounts due from mobile phone network operators for commissions earned; banks for
customer credit card, certain debit card and electronic benefits transfer (EBT) transactions; and vendors for various vendor
funding programs.
We establish allowances for uncollectible receivables based on historical collection trends and write-off history. Our allowances
for uncollectible receivables were $92 million and $72 million at February 2, 2013, and March 3, 2012, respectively.
Merchandise Inventories
Merchandise inventories are recorded at the lower of cost using either the average cost or first-in first-out method, or market.
In-bound freight-related costs from our vendors are included as part of the net cost of merchandise inventories. Also included in
the cost of inventory are certain vendor allowances that are not a reimbursement of specific, incremental and identifiable costs
to promote a vendor's products. Other costs associated with acquiring, storing and transporting merchandise inventories to our
retail stores are expensed as incurred and included in cost of goods sold.
Our inventory valuation reflects adjustments for anticipated physical inventory losses (e.g., theft) that have occurred since the
last physical inventory. Physical inventory counts are taken on a regular basis to ensure that the inventory reported in our
consolidated financial statements is properly stated.
Our inventory valuation also reflects markdowns for the excess of the cost over the amount we expect to realize from the
ultimate sale or other disposal of the inventory. Markdowns establish a new cost basis for our inventory. Subsequent changes in
facts or circumstances do not result in the reversal of previously recorded markdowns or an increase in the newly established
cost basis.
Restricted Assets
Restricted cash and investments in debt securities totaled $366 million and $461 million, at February 2, 2013, and March 3,
2012, respectively, and are included in Other current assets or Equity and Other Investments in our Consolidated Balance
Sheets. Such balances are pledged as collateral or restricted to use for vendor payables, general liability insurance, workers'
compensation insurance and insurance business regulatory reserve requirements.
Property and Equipment
Property and equipment are recorded at cost. We compute depreciation using the straight-line method over the estimated useful
lives of the assets. Leasehold improvements are depreciated over the shorter of their estimated useful lives or the period from
the date the assets are placed in service to the end of the lease term, which includes optional renewal periods if they are
reasonably assured. Accelerated depreciation methods are generally used for income tax purposes.
Table of Contents